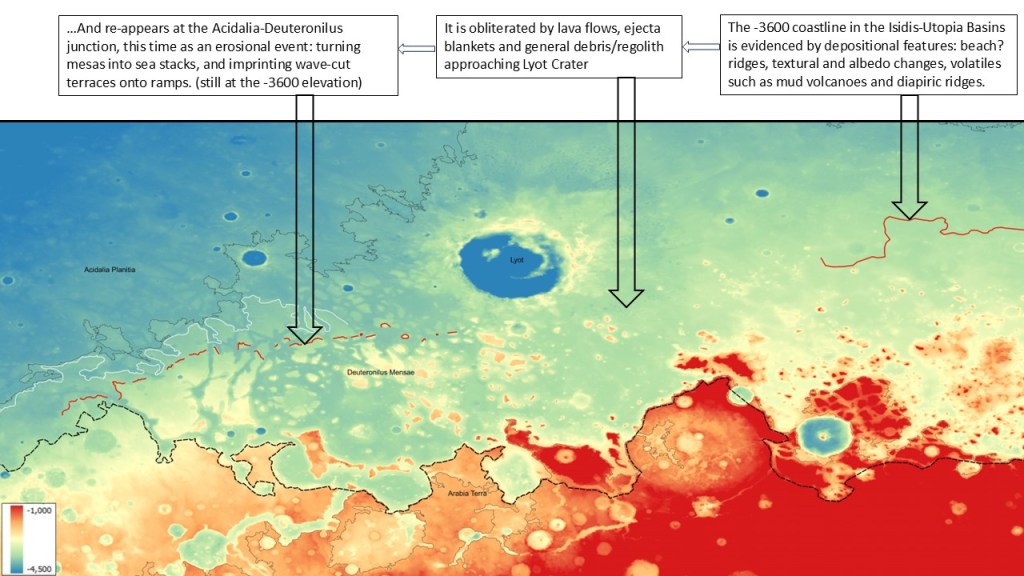
irection, the coastline disappears under lava flows and ejecta blankets. However, at Deuteronilus Mensae, it can be seen as an erosional event, carving mesas into sea-stacks and terraces onto the big north-west dipping ramps.
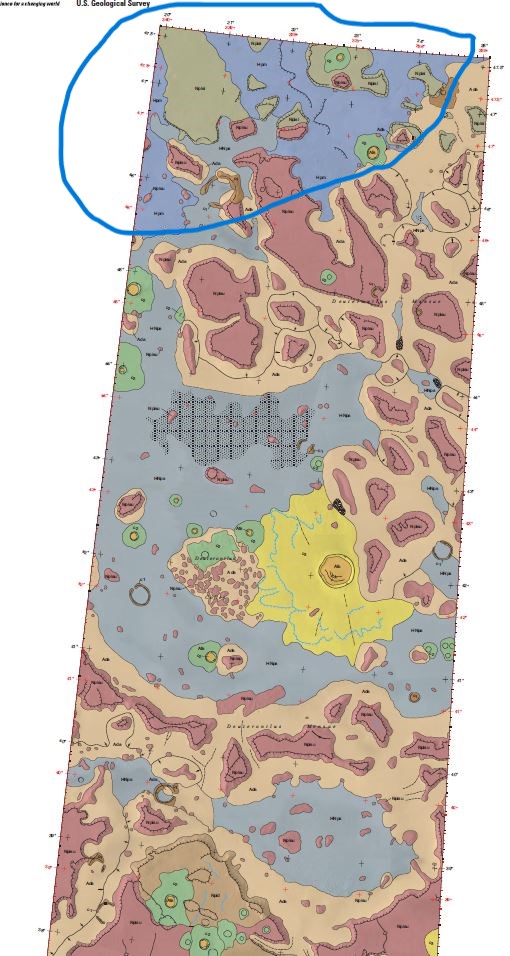
But first we have to look at the geology of the DM area:
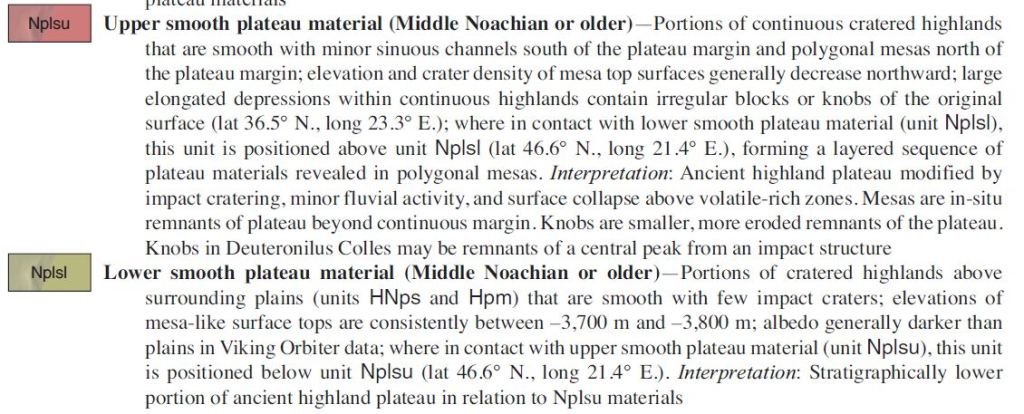
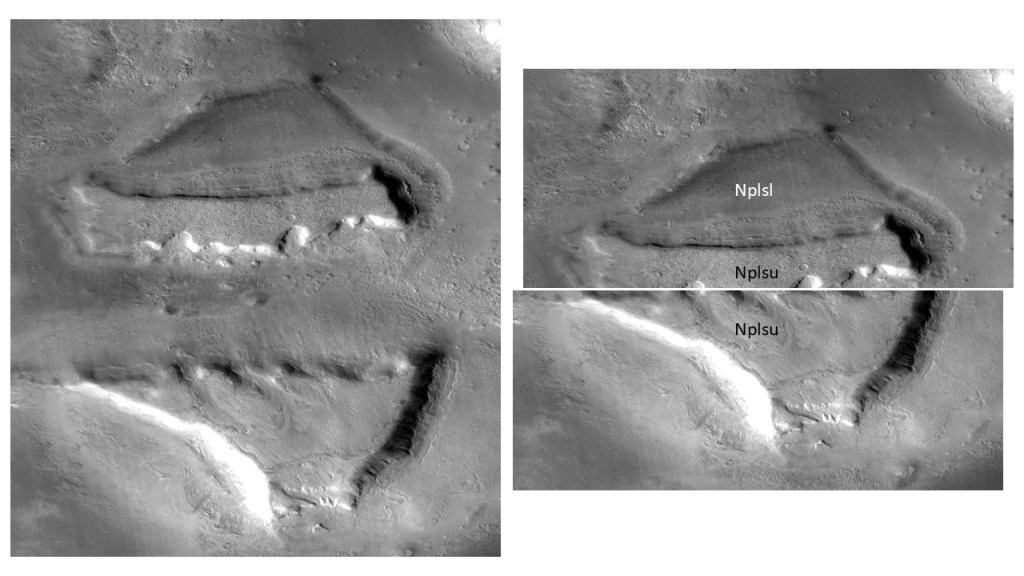
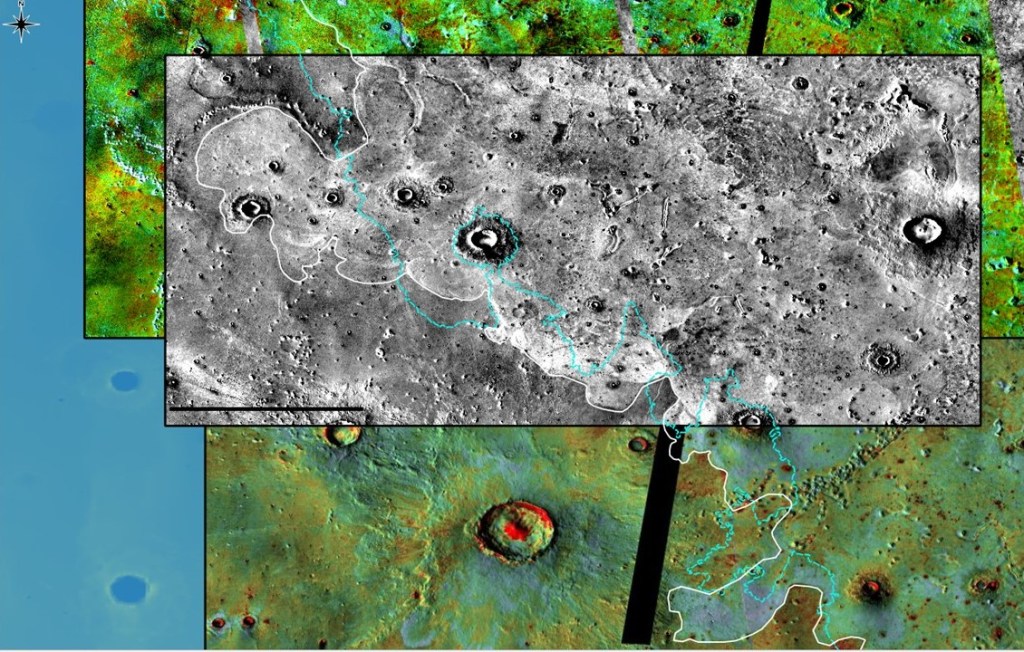
Translation: Plateau material is divided into an upper, light unit and a lower, dark unit, easily distinguishable on both day and night infrared.
Taking the northern portion of the map, and relating it to the images:

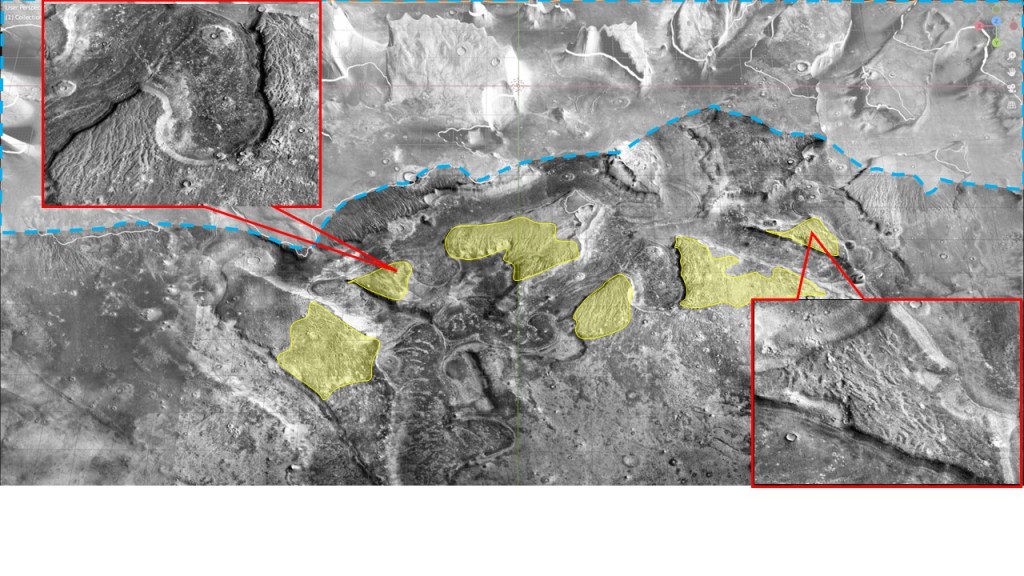
The yellow line indicates the regional boundary between the upper and lower mesa units; to the north of the line the white mesa has been eroded, revealing the lower black mesa.
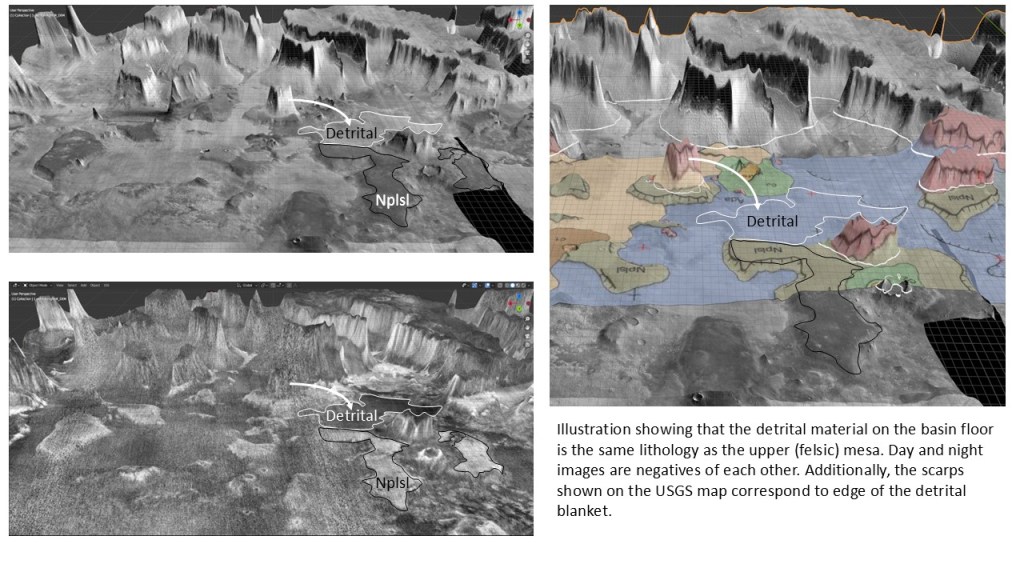
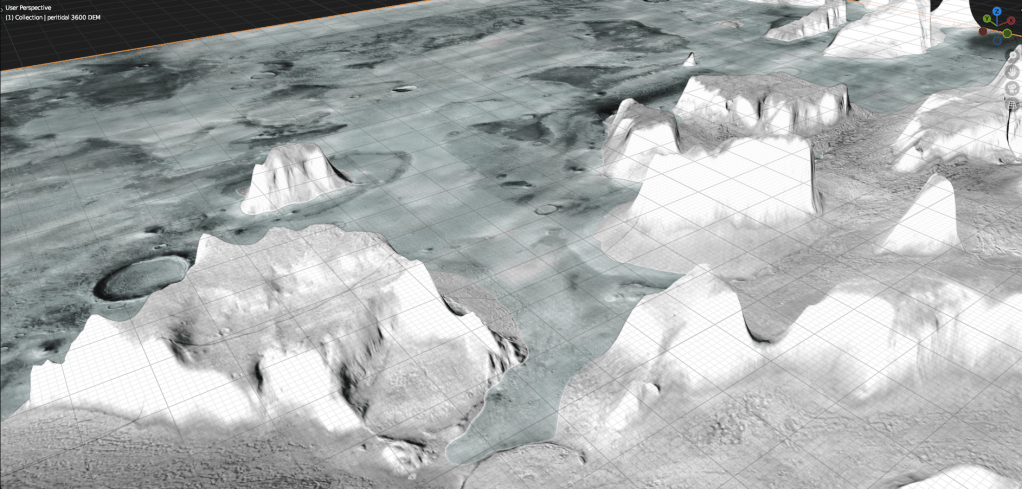
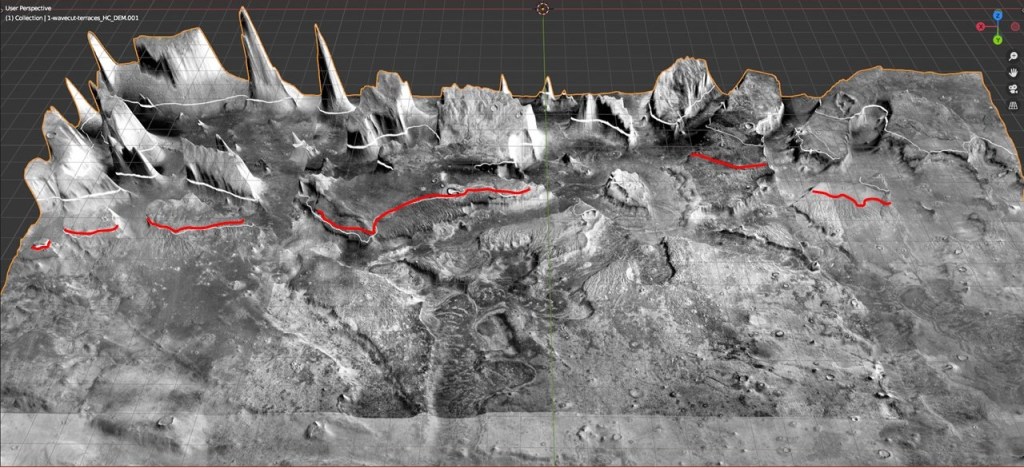
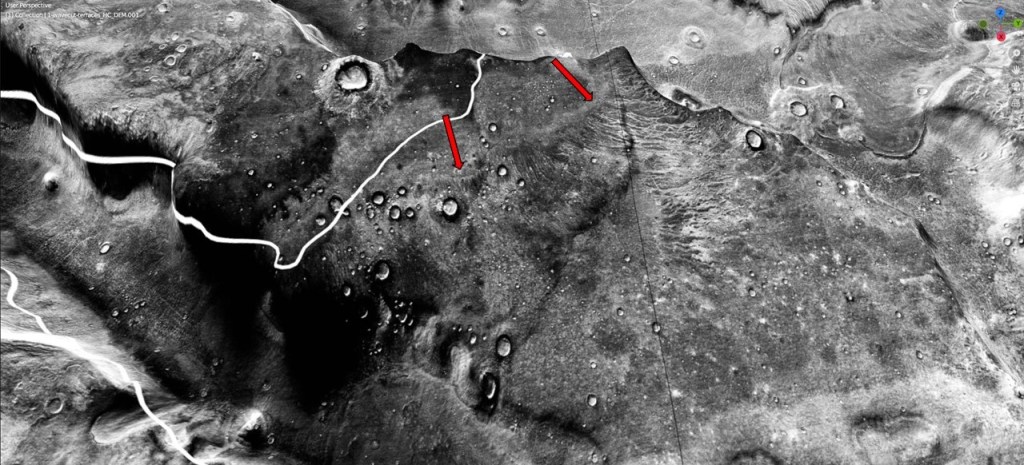
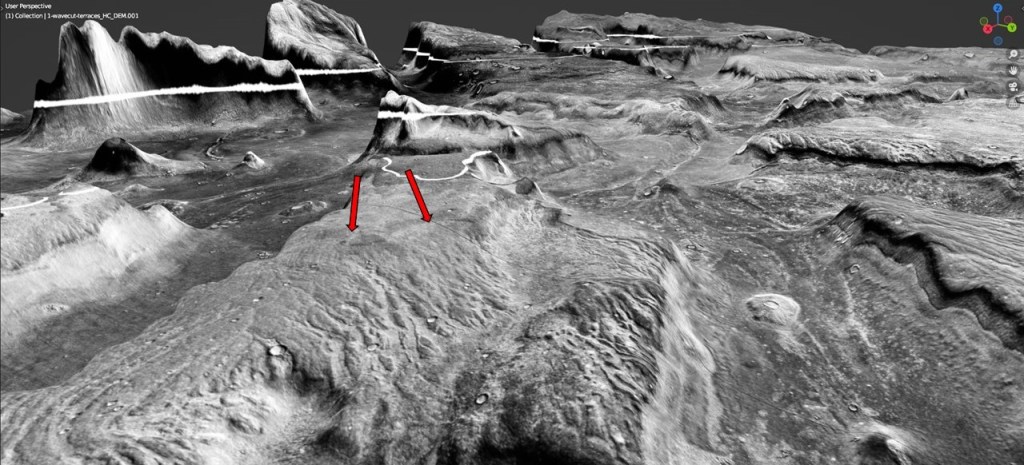
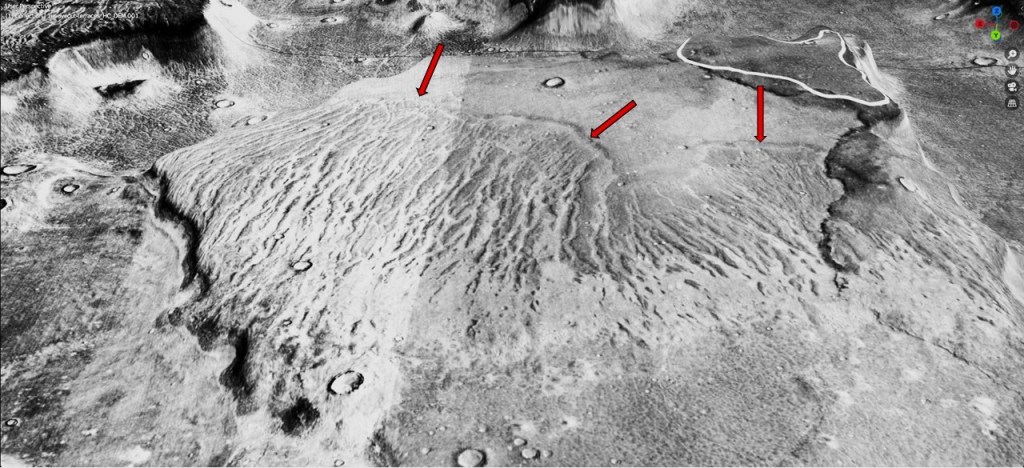
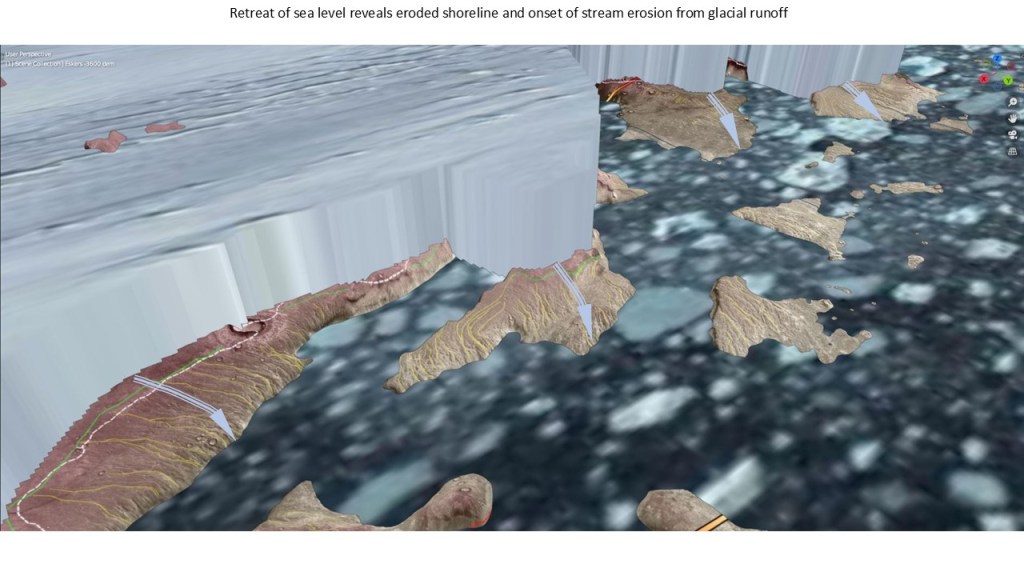
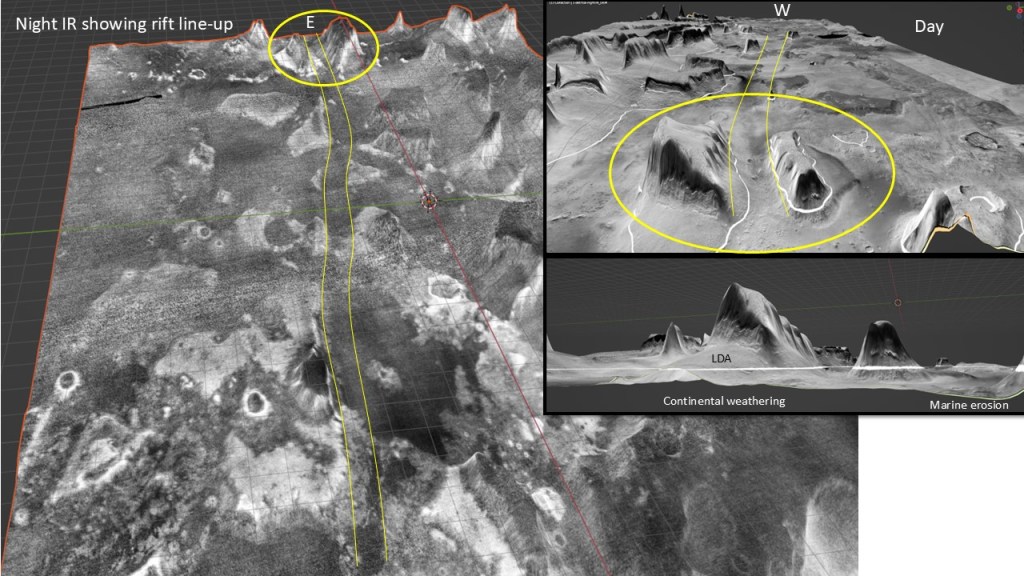
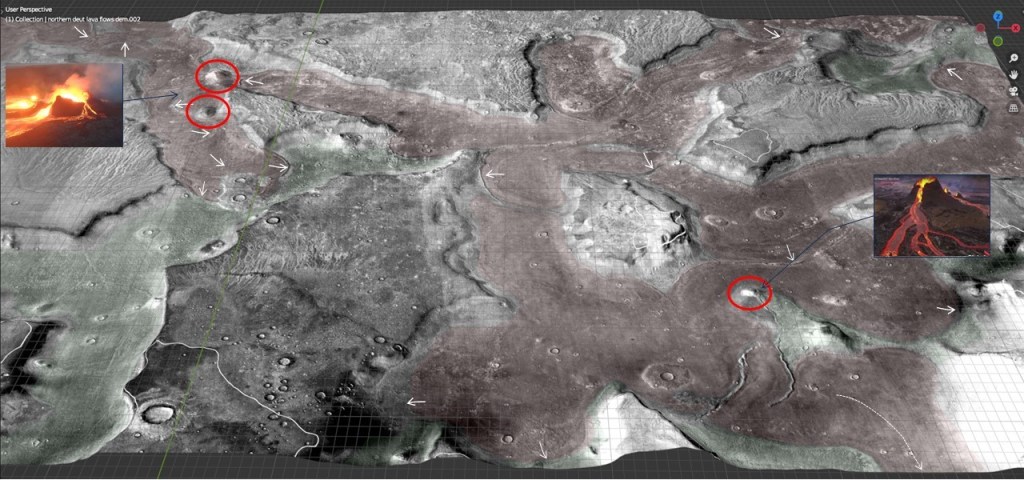
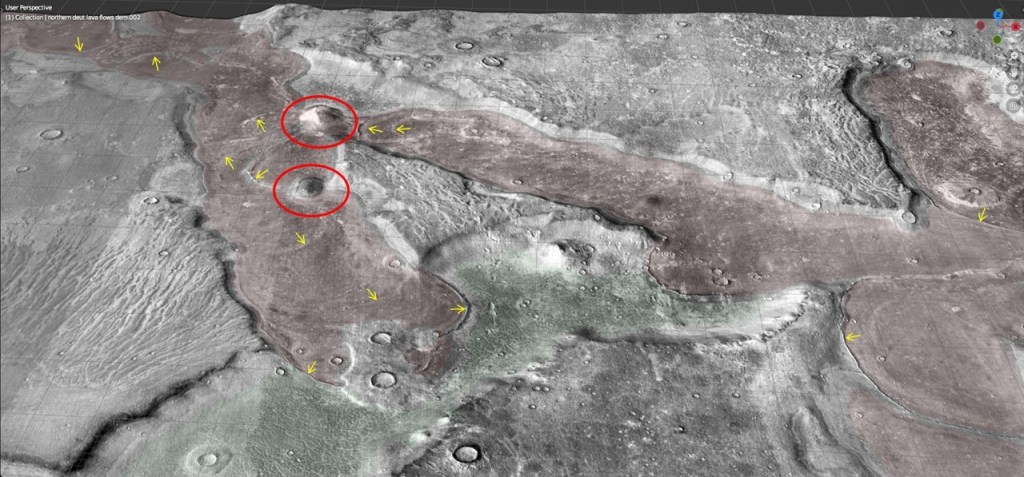
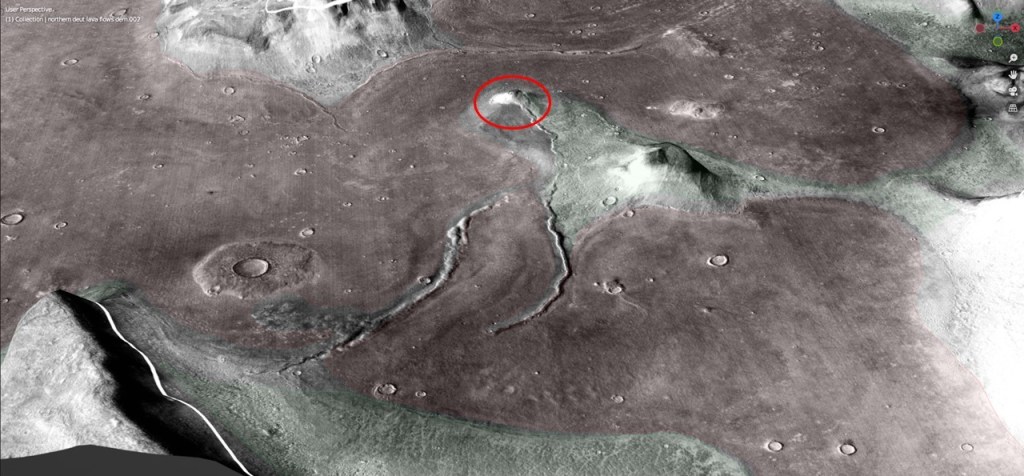
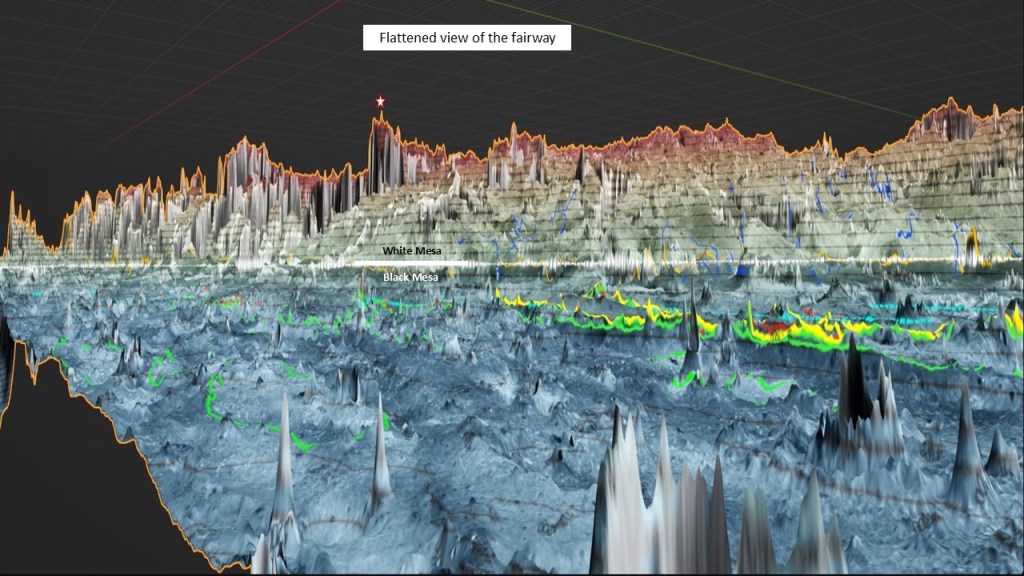
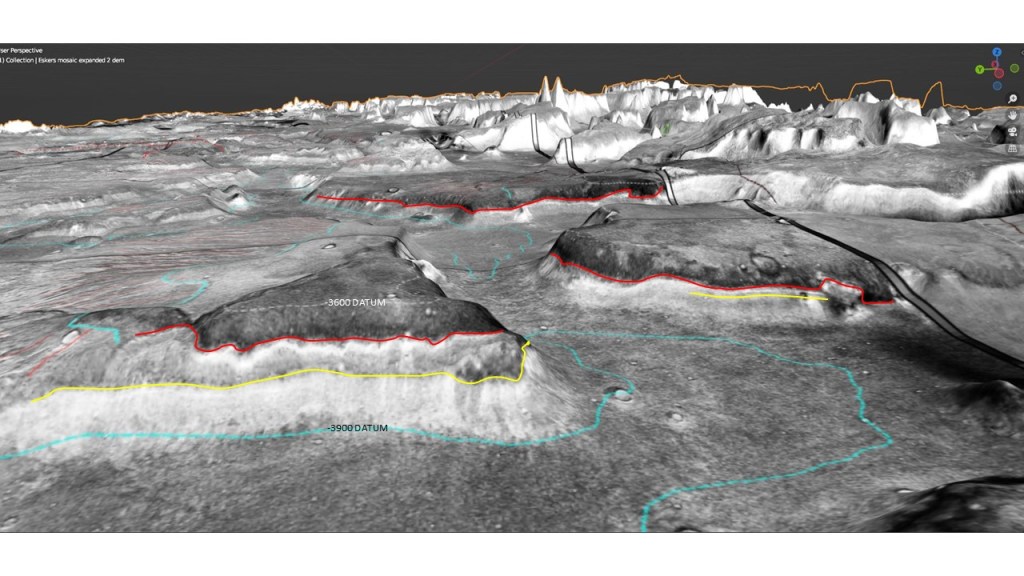
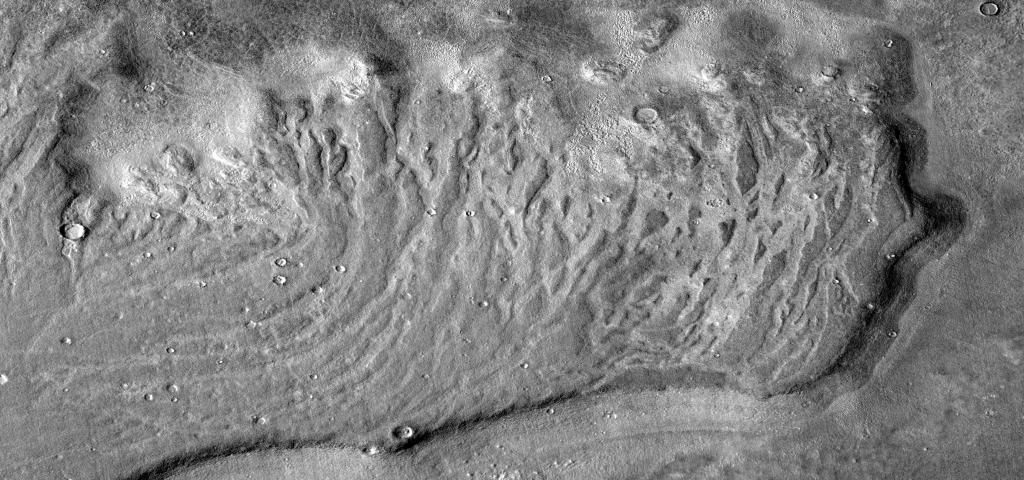
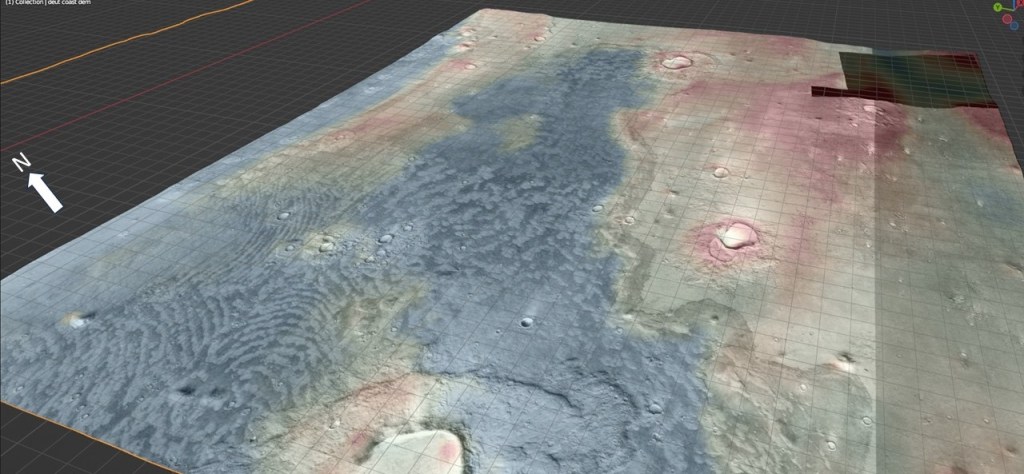
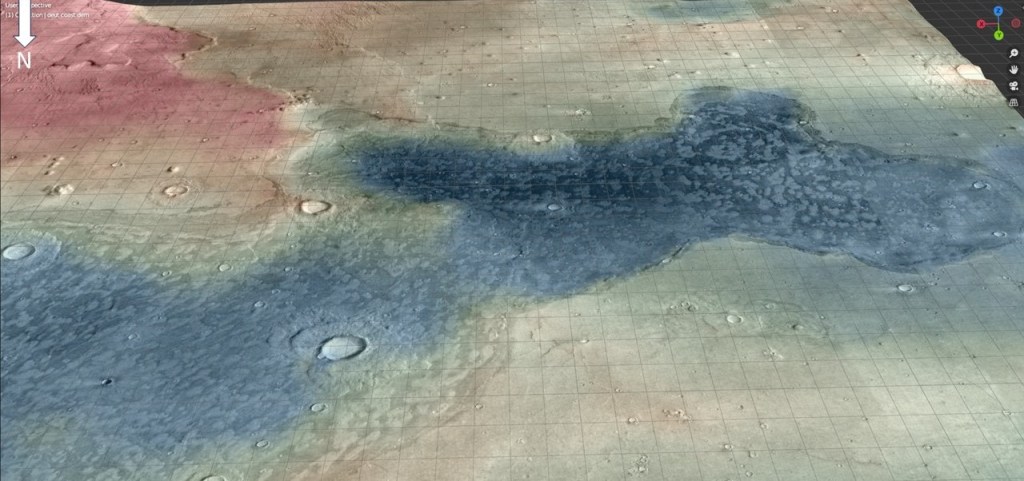
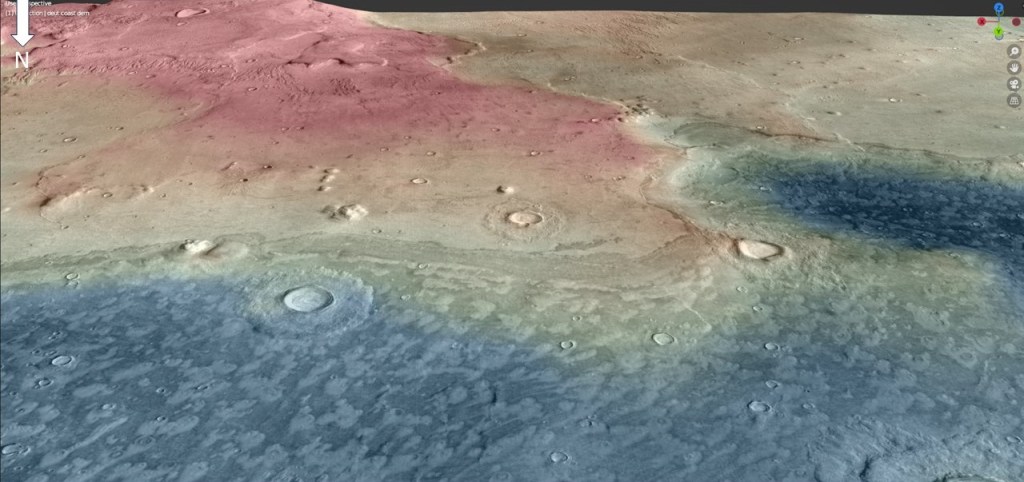
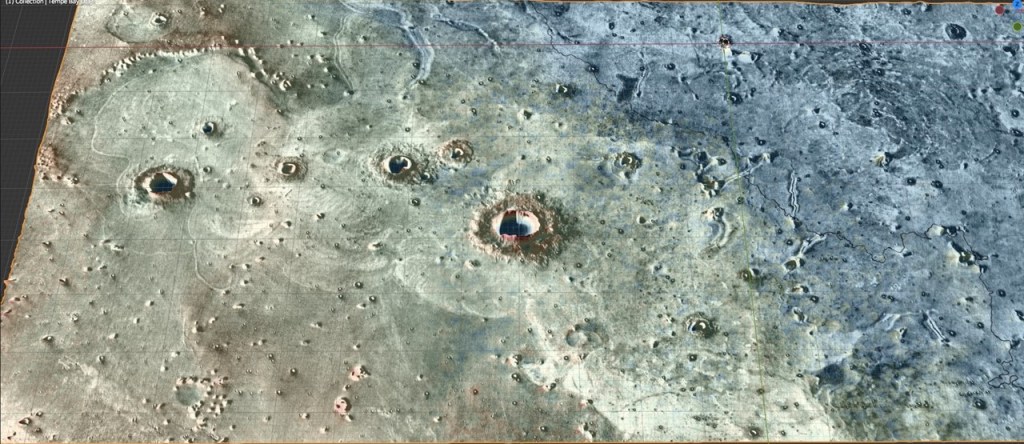
The following illustrations employ JMars5 images draped over a MOLA digital elevation model, rendered in the Blender 3D modeling app. The model here is of coastal erosion of the upper (felsic) mesas down to the level of contact with the lower (mafic) platforms. The contact is at approximately -3600m. The upper, less competent rocks are undercut by wave action, broken up, and dispersed as detritus on the sea floor. The lower, more resistant basalts remain largely intact as platforms whose outlines likely represent the outlines of the pre-erosional mesas. The style of erosion/weathering changes in the inland direction to mechanical weathering, with debris accumulating as lobate aprons up against the mesas.
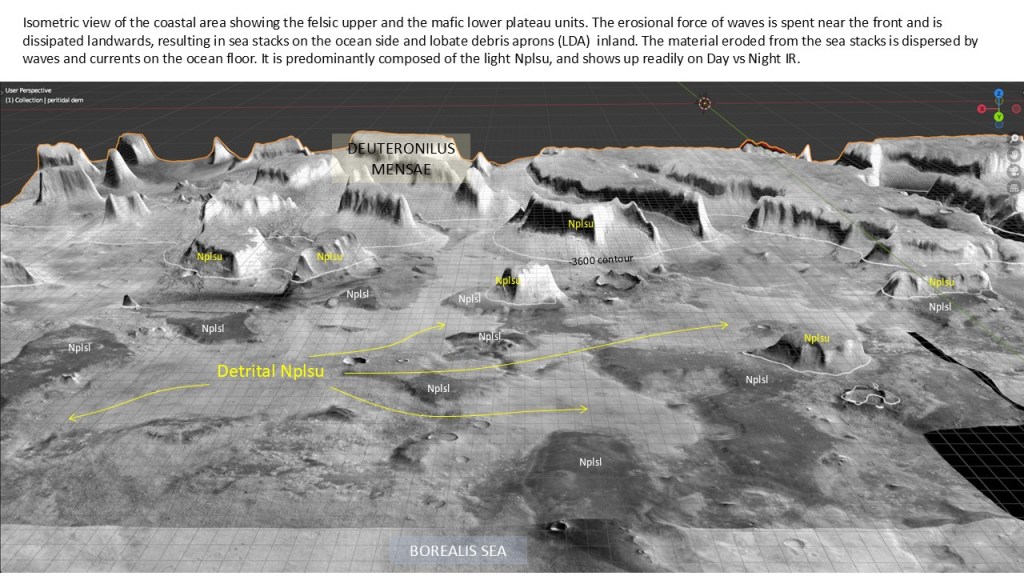
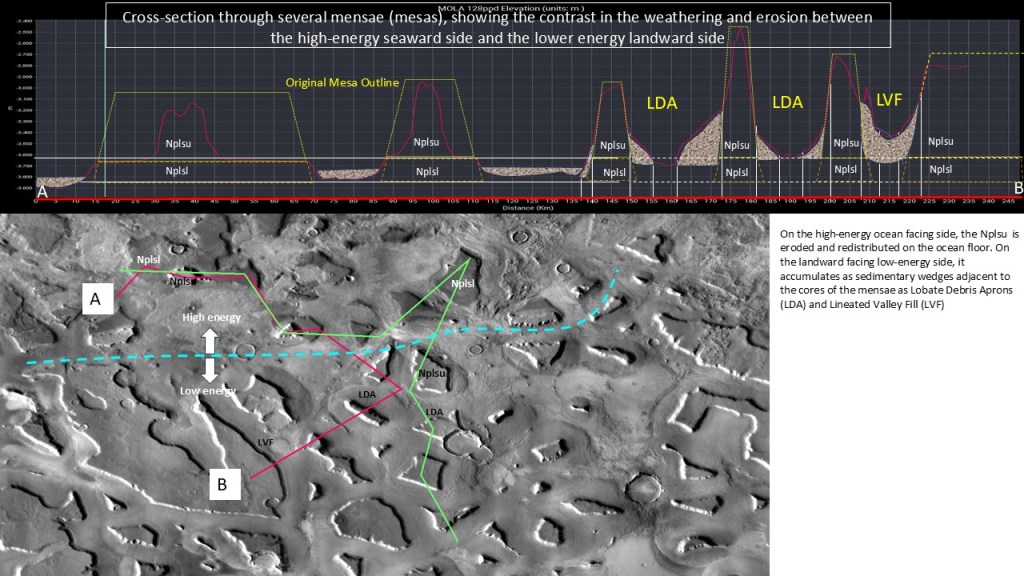
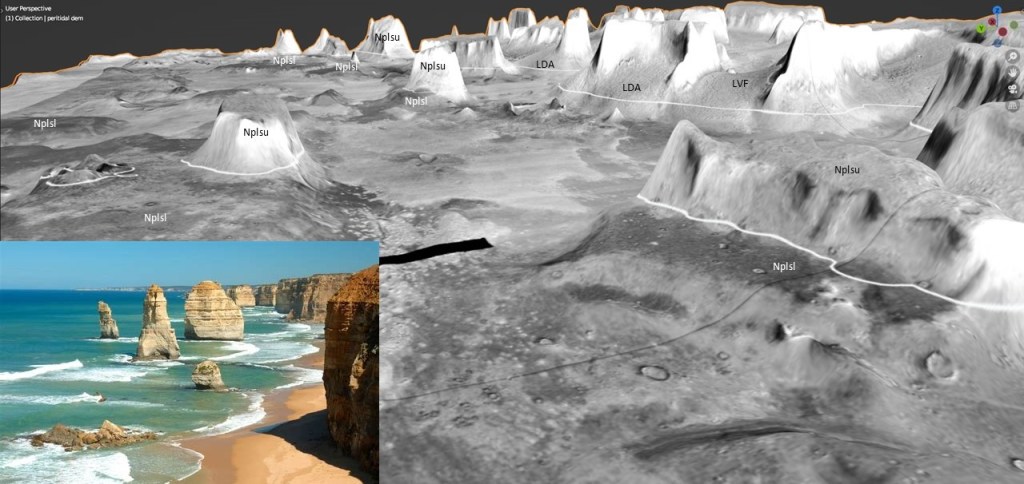
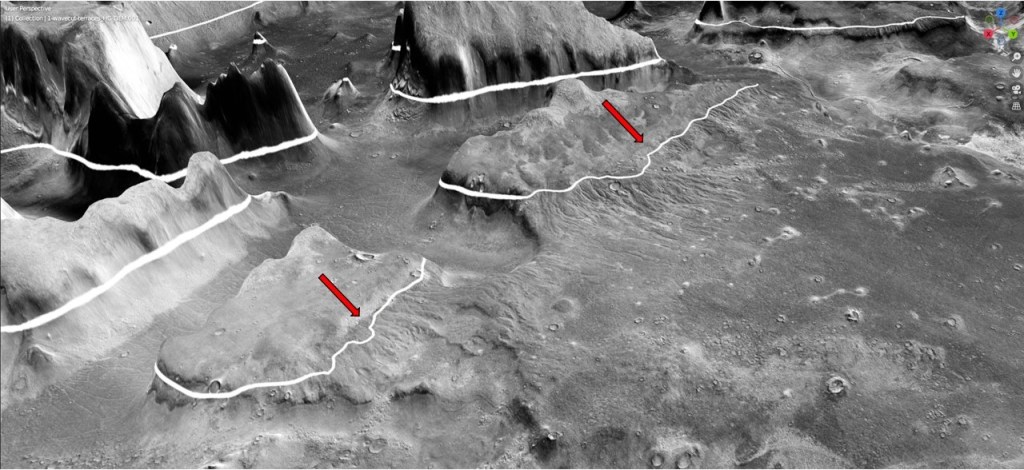
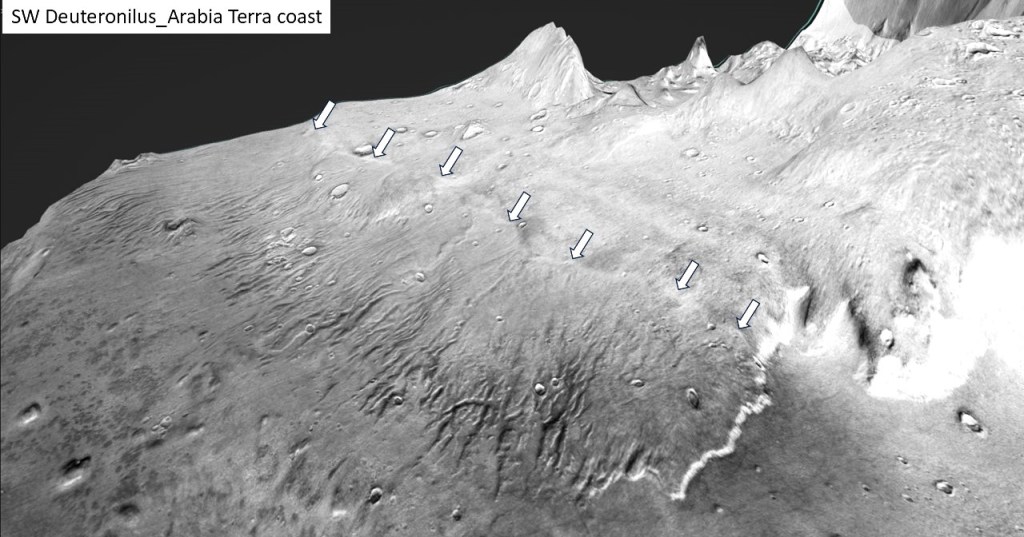
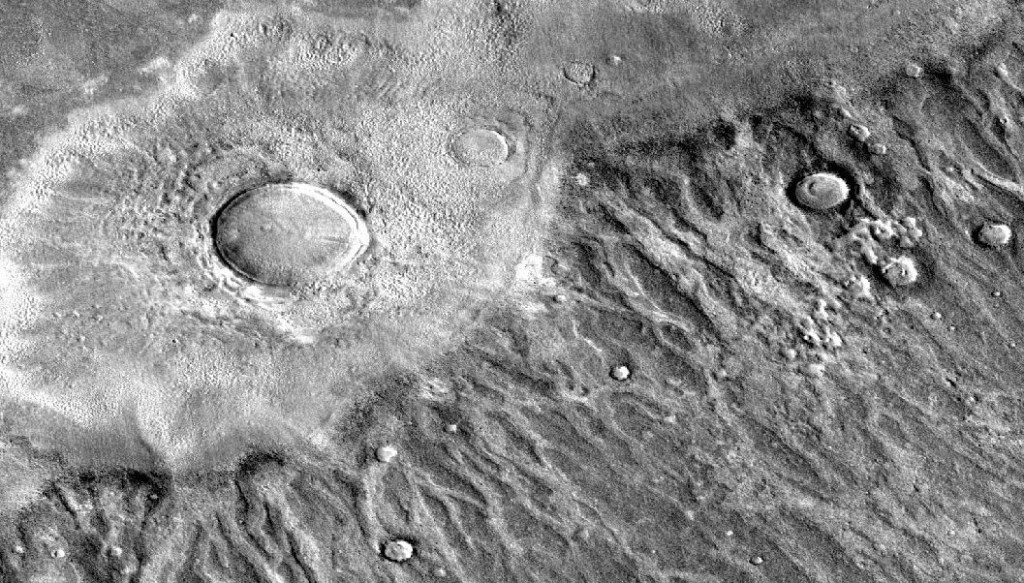
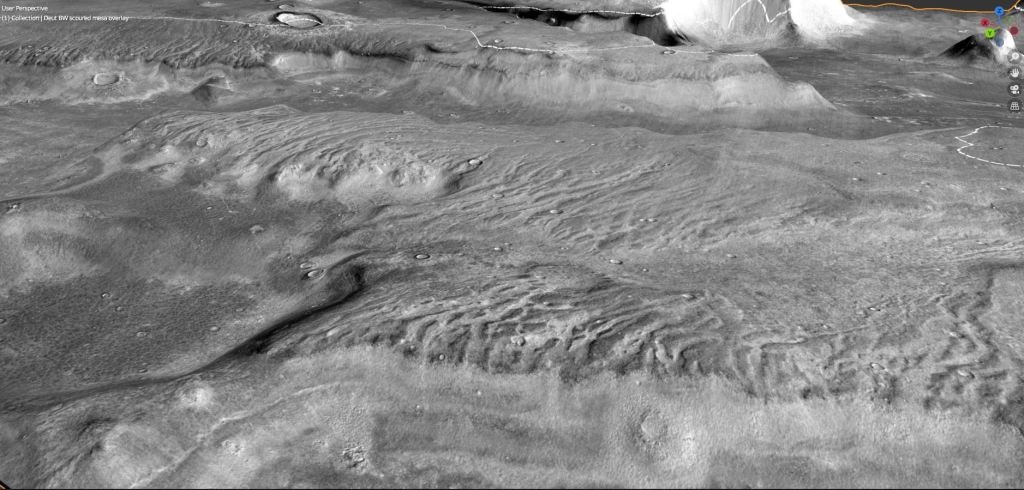
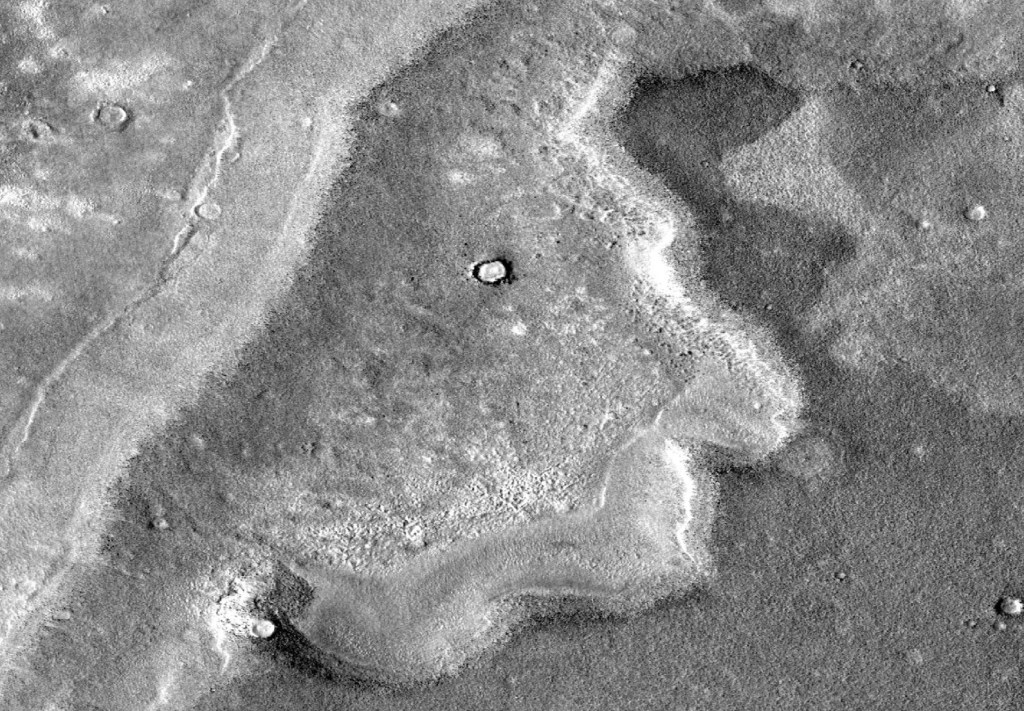
The following two illustrations show the difference in the weathering/erosion between the seaward facing mensae and those situated farther inland. The former are undercut and eroded by high-energy waves and the resulting rubble deposited and distributed on the adjoining sea floor. The inland mensae, on the other hand, are subject to mechanical weathering (mainly warm/cold cycles), and the rubble ends up adjacent to the source mensae as Lobate Debris Aprons (LDA) thought to be cored by ice. Adjacent to elongated mensae, they form Lineated Valley Fill (LVF)
Day and night images showing the association between the upper mesas and the detrital material:
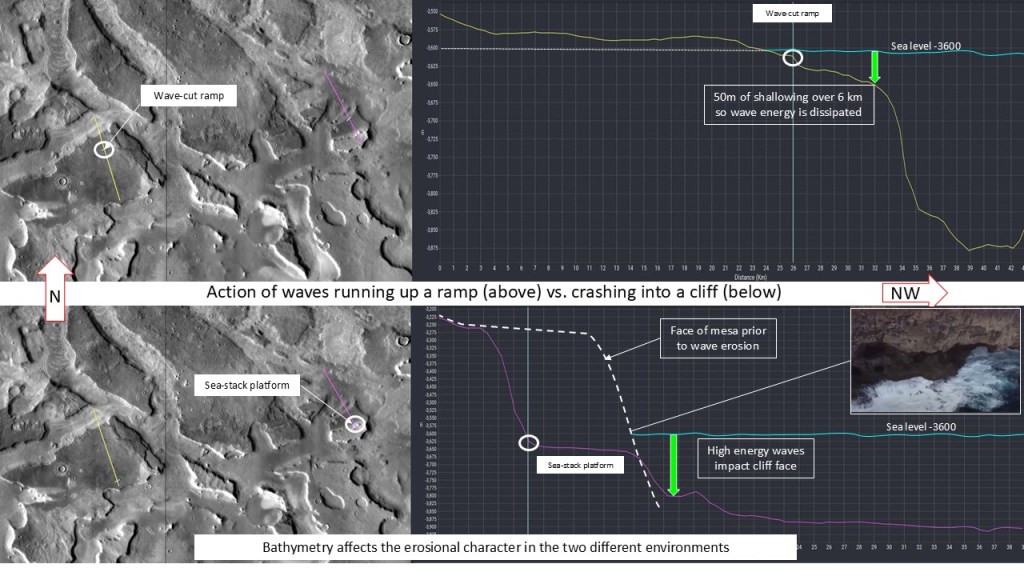
The mechanics of coastal erosion: shown below are two transects, the upper one down a ramp, the lower, a sea-stack on a basal platform. Waves ascending the gradually shallowing ramp are attenuated by the time they impinge on the shoreline, and create a small terrace. Waves approaching the sea-stack (cliff) undercut it and create a platform at wave base.
Side view with the hypothetical -3600 ocean: note the peneplanation of the lower platform to about 50m below sea level, the presumed wave base:
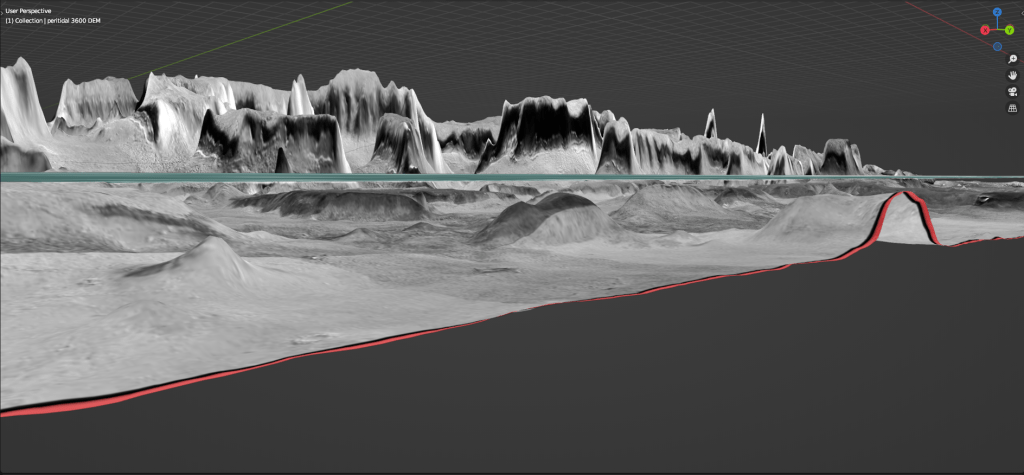
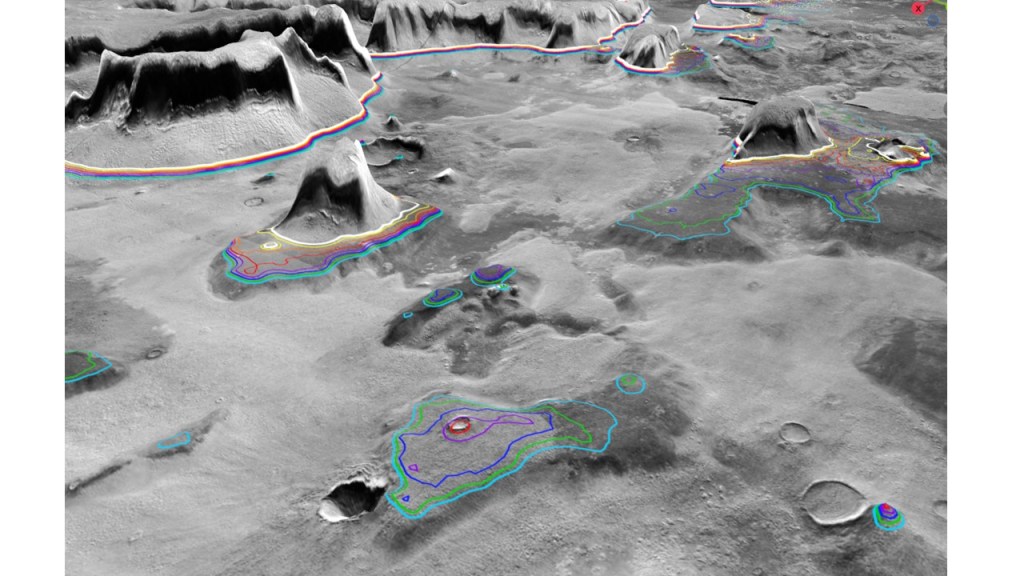
To put a finer point on it, an image showing contours, at 10m intervals, from -3600 (presumed sea level) to -3670. This 50m-70m wave base might give some clues about the sea state, wind strength, and ultimately, the atmosphere when combined with other kinds of data.
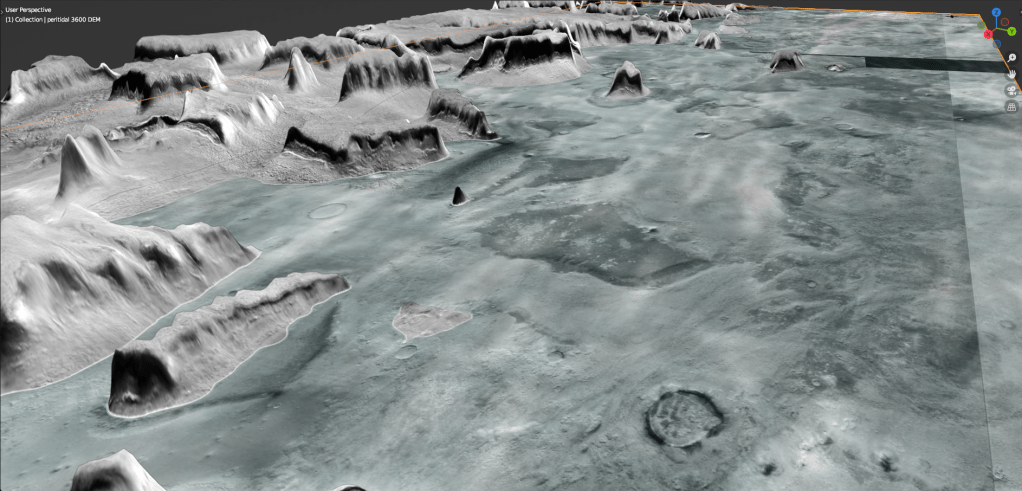
Another image, with a translucent ocean showing the -3600m coastline and the dark lower mesa shoals:
Beachfront property:
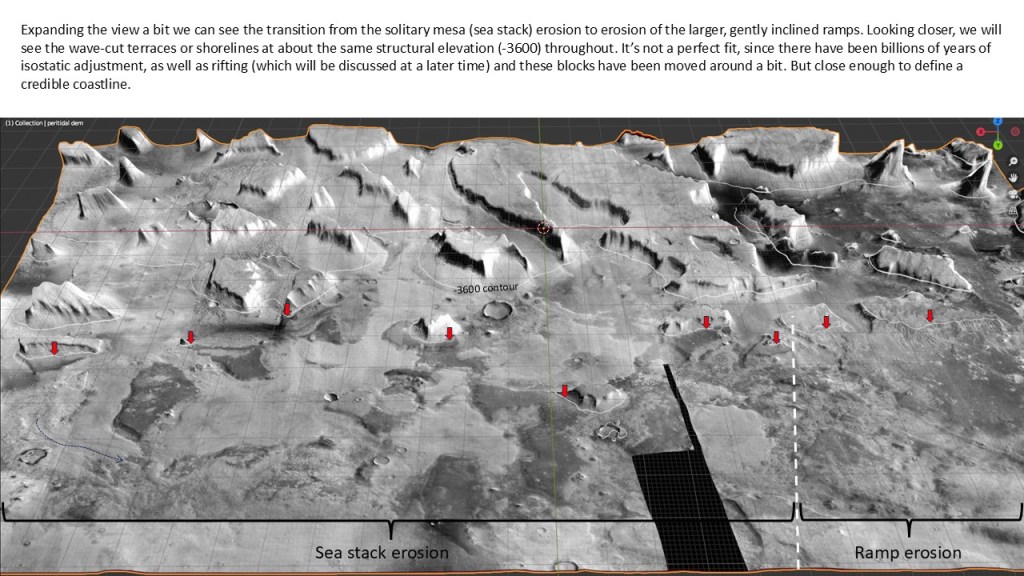
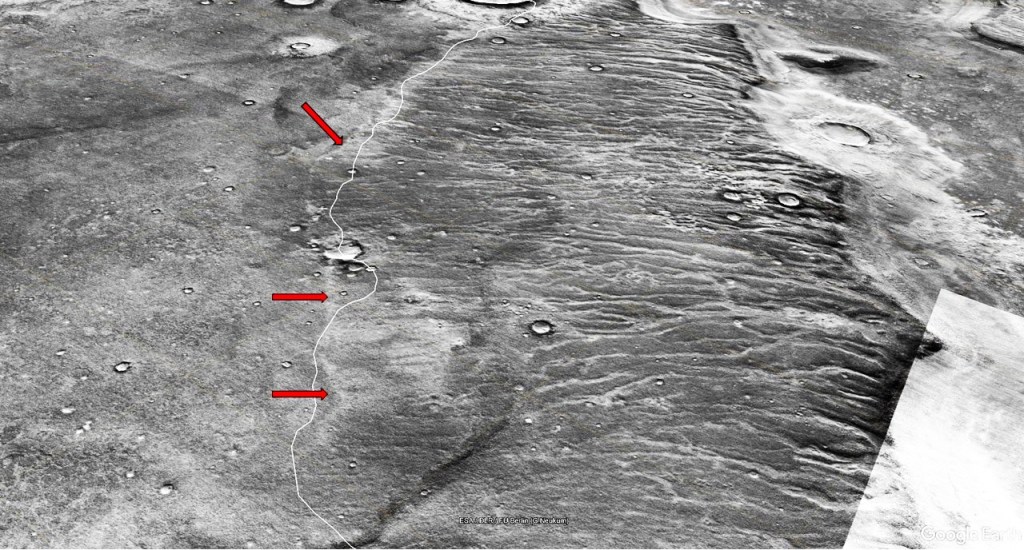
Extending this erosional interpretation along strike to the sloping ramps, we see a horizontal cut at the same elevation:
“
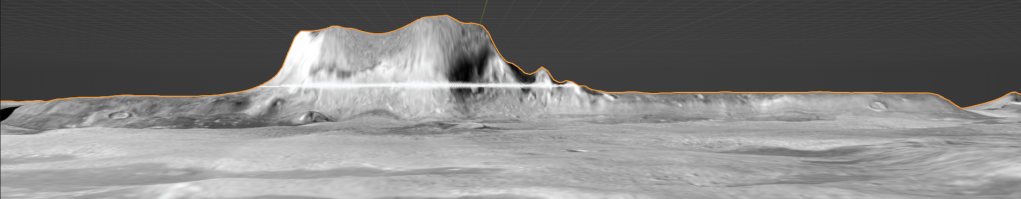
On the view along the coast, note that all the erosion is happening on the seaward side; the basic model is shown here, with the water line represented by the white -3600 contour. The insert is an analog, “The Twelve Apostles” from Princetown, Victoria, Australia.
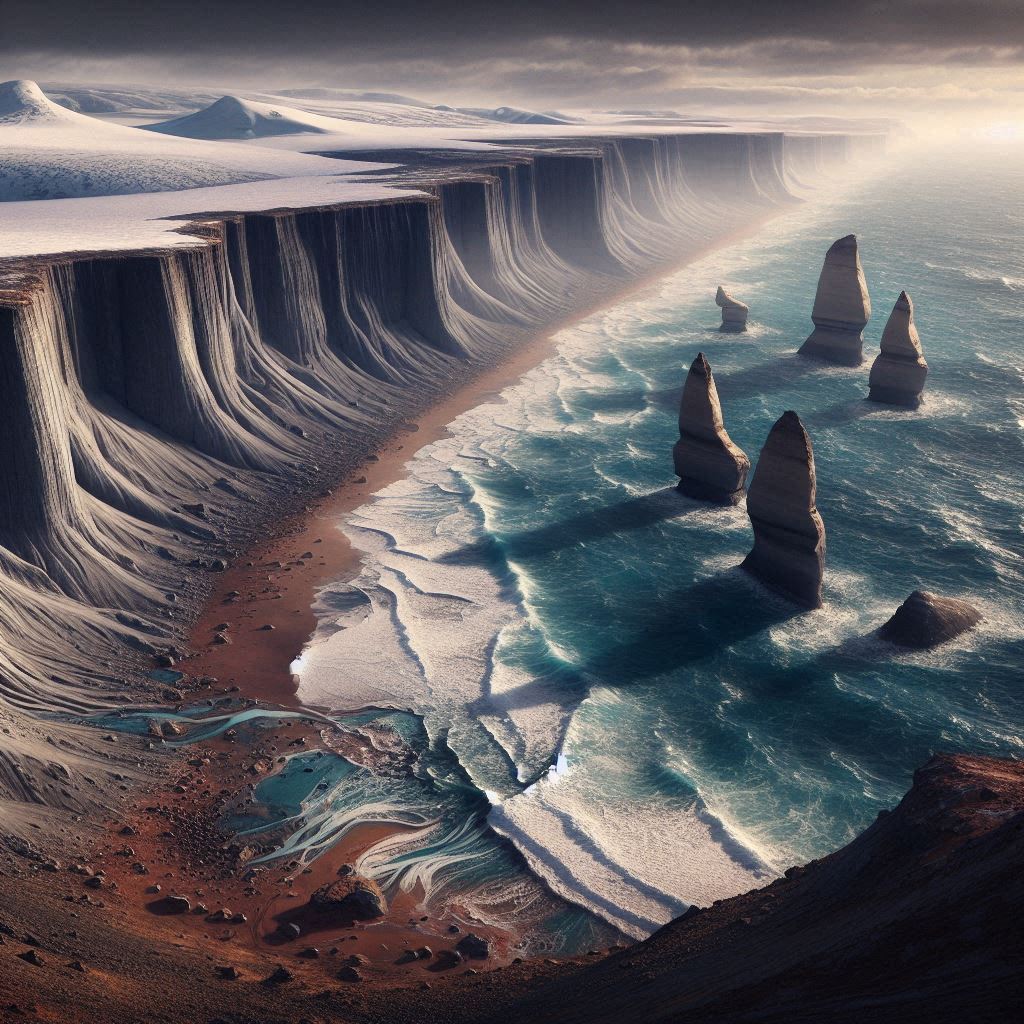
An artistic rendering by DALL E:
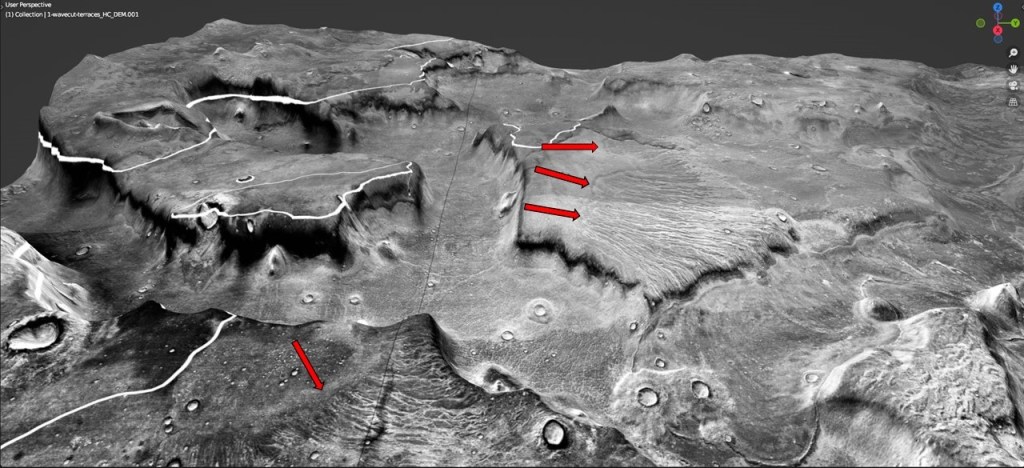
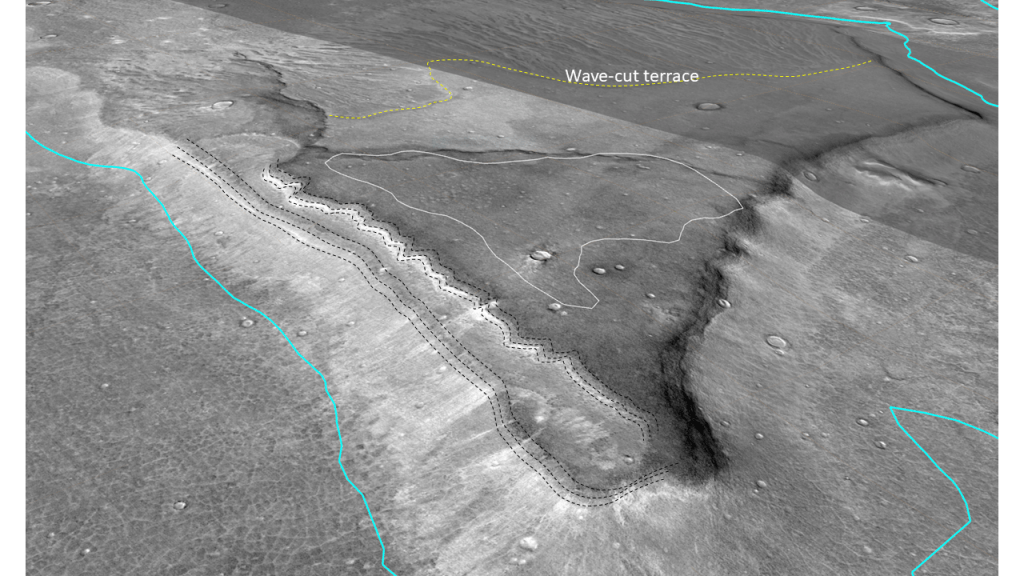
That takes care of the sea-stacks. Moving on to the wave-cut terraces, these are arranged along strike, heading SW:
In each of the examples below, the white line represents the -3600m contour, and it will be noticed that the etched shoreline is quite close to this marker.
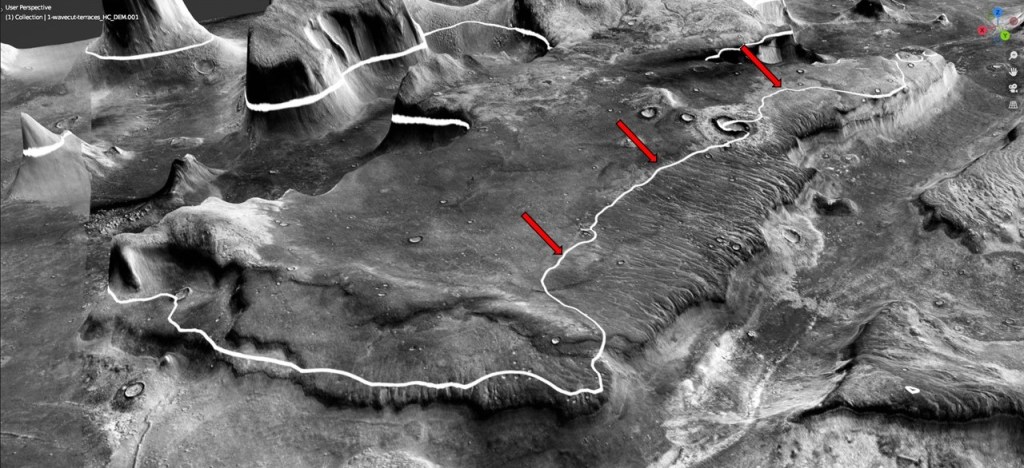
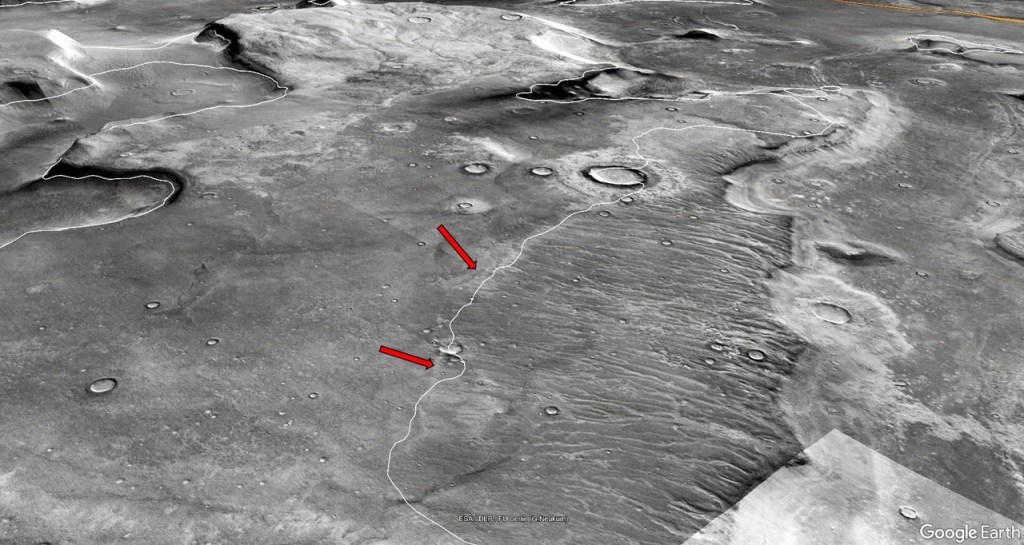
Where the shoreline and the marker diverge, two explanations are offered:
- Isostatic adjustments of he crust
- Horizontal translation of the blocks/raps
It will by now be apparent that there are two major erosional features here: one following the regional strike roughly parallel to the -3600structure contour, the other in a dip direction, following a drainage. How to account for both of these?
For the first, imagine an ocean at high-stand for a very long time, cutting into the shoreline to form a terrace; for the second, an ice-cap right up to the water’s edge, remaining after the sea recedes, melting from the bottom due to heat coming up from the crust, and eroding the newly exposed foreshore. As an analog, take Bouvet Island in the South Atlantic.
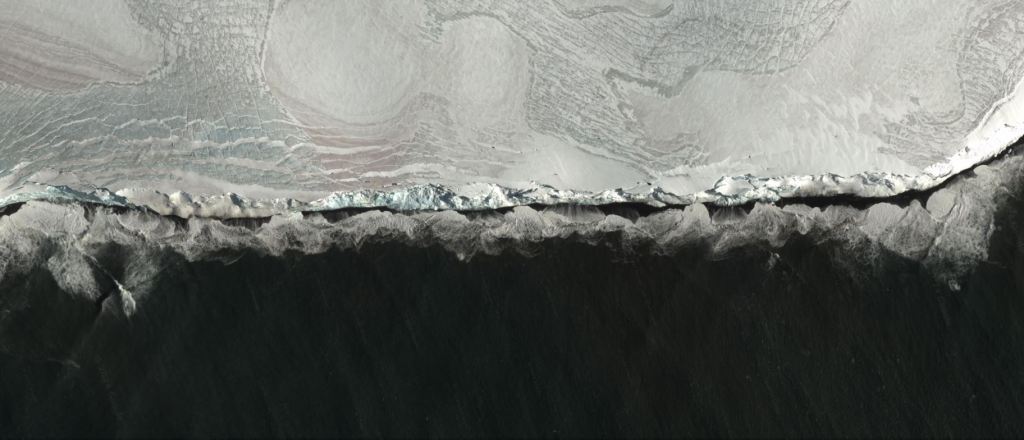
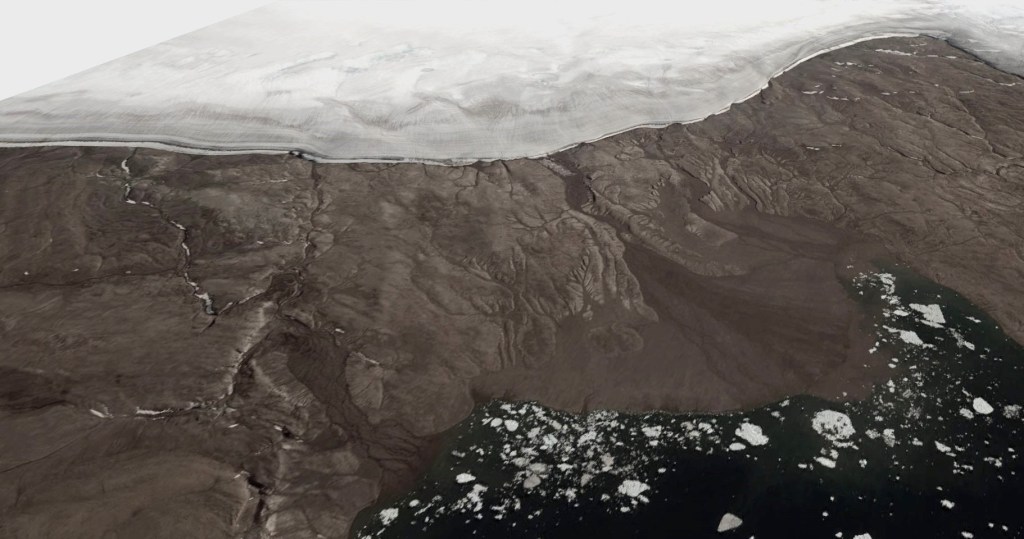
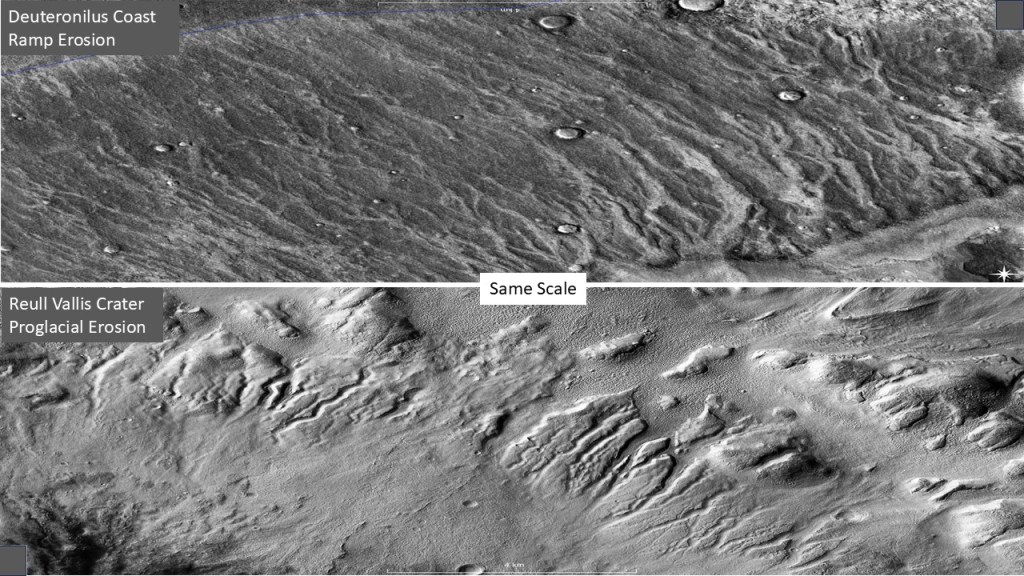
An analog of the meltwater erosion shown below is from Danmark Fjord in Northeast Greenland:
Another example, from a Reull Vallis crater, showing erosion below a glacier (now retreated):
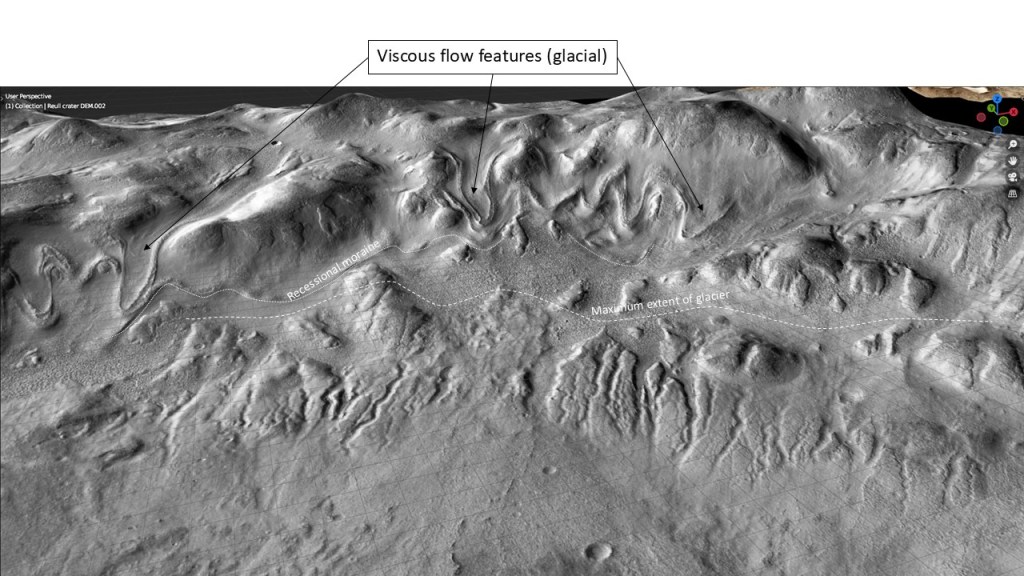
Enlargement of the Deuteronilus and Reull Vallis scours, at the same scale:
To summarize,
I’ve made a model of an icecap and an ocean at -3600m for illustration. At this stage, the wave-cut terrace is incised.
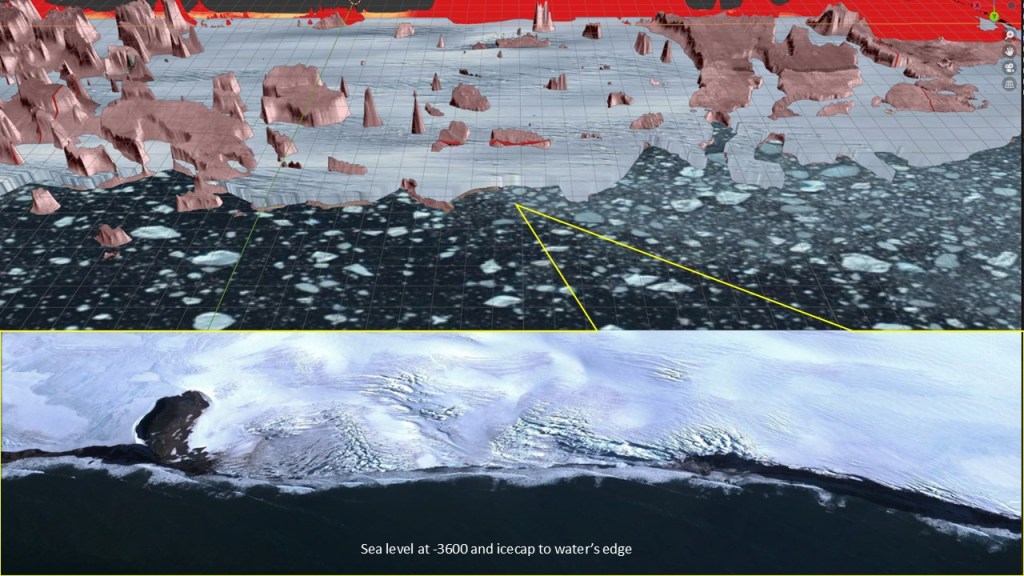
Dropping sea level 50m initiates the process of (dip-oriented) erosion. The ice acts like a cohesive stationary body in a low gravity, low relief setting, melting at the base as a result of crustal heat flux.
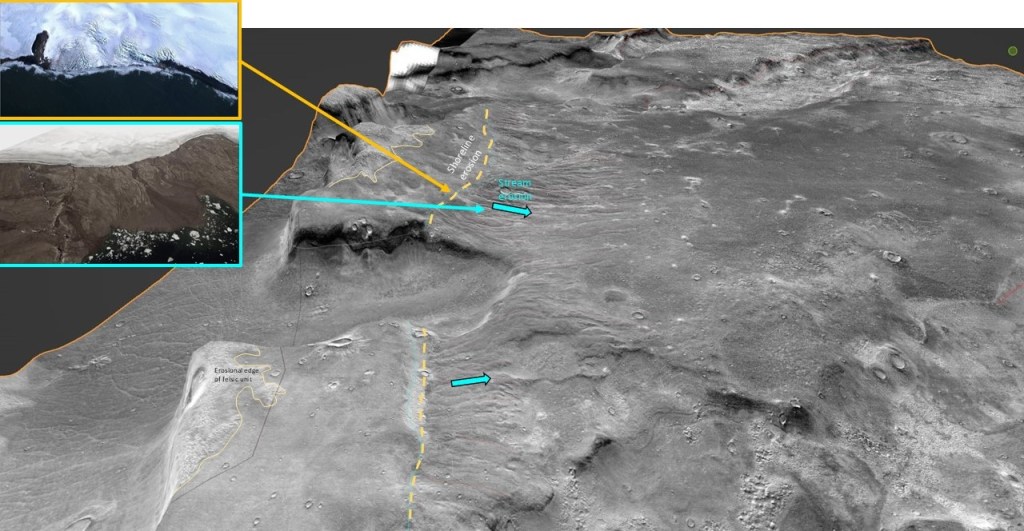
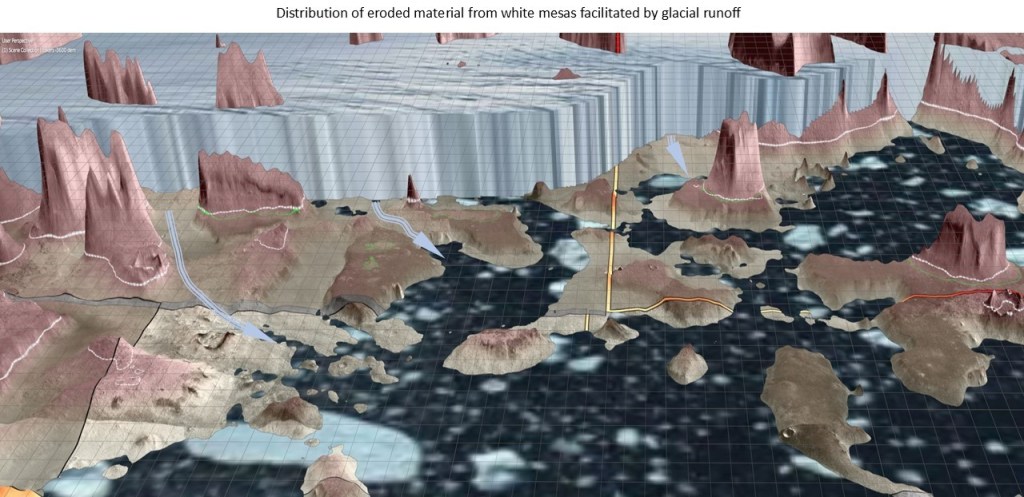
In addition to eroding the ramps, the glacial meltwater also re-distributed the detrital material as the ocean receded as seen in the following two slides:

We still need to account for the detached, eroded “islands” which have no communication with the icecap and its meltwater? One possibility is that they have moved out since the erosional event, and no longer represent the original configuration.
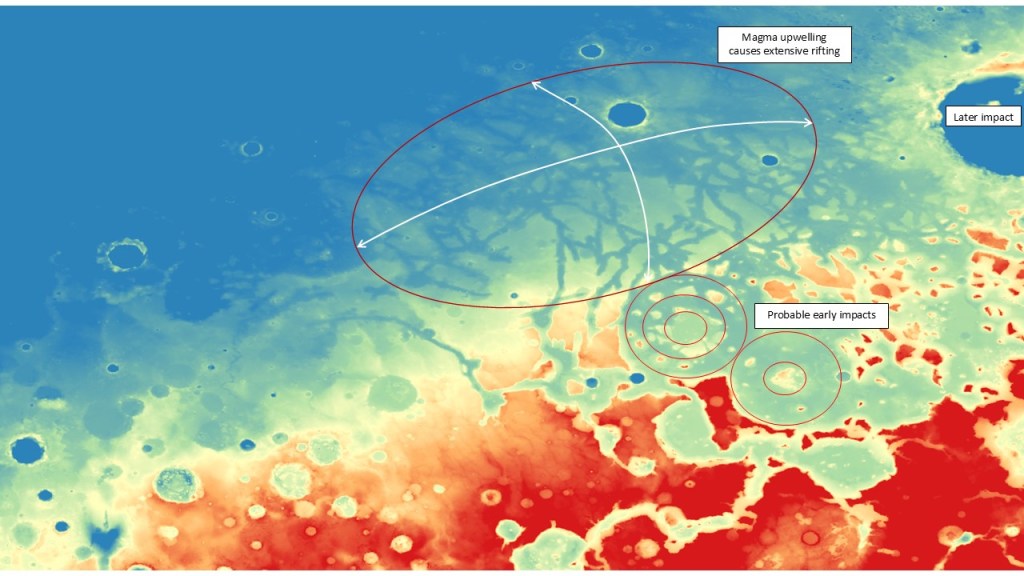
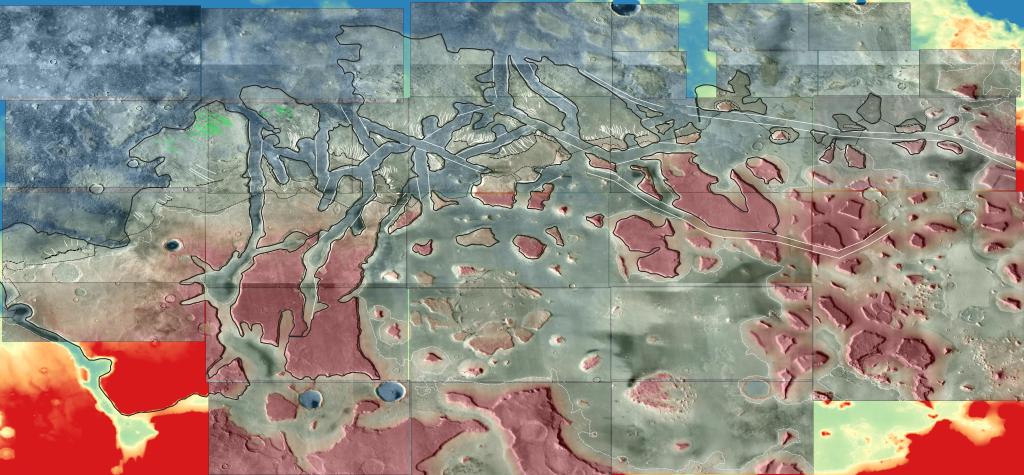
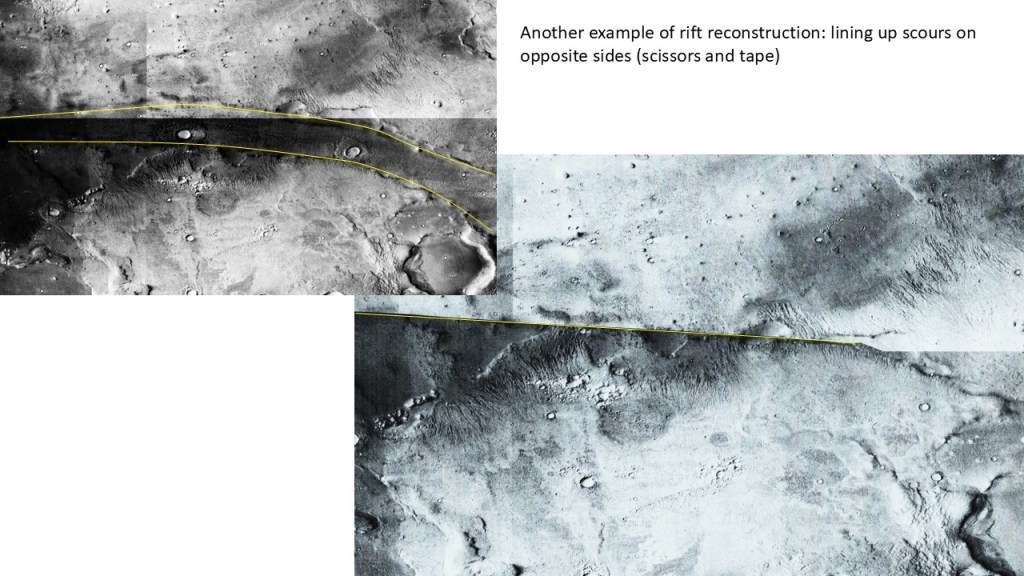
A bird’s-eye view reveals a pattern of rectilinear rifts which have broken up many of the mesas and ramps in the area, likely as a result of thermal (magmatic) uplift. Some suggestions have been made that these are glacial valleys, but neither are they U-shaped in cross-section (as are alpine glaciated valleys), nor is the terrain steep enough for glaciers to have moved much so I think rifting is the better model.
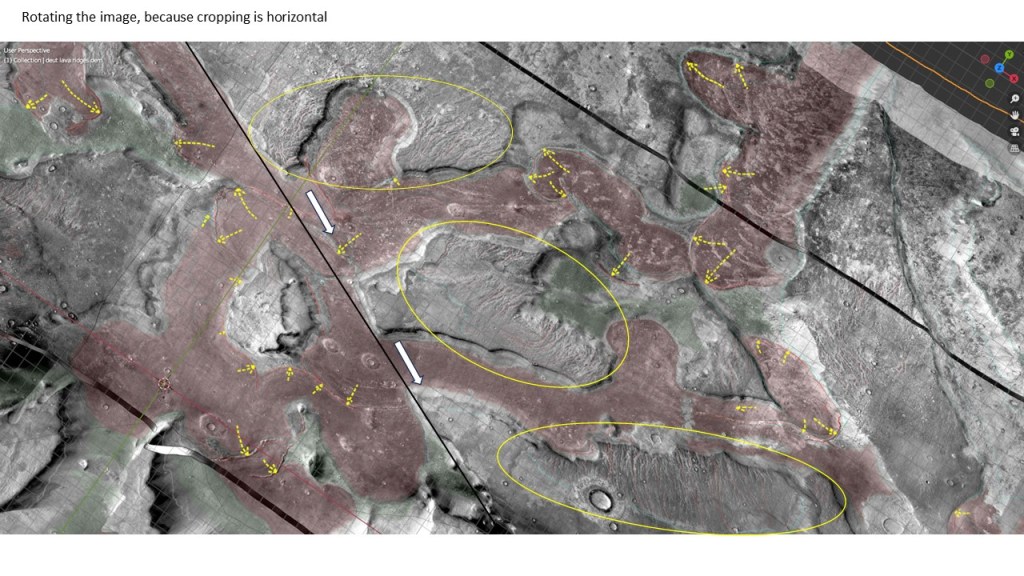
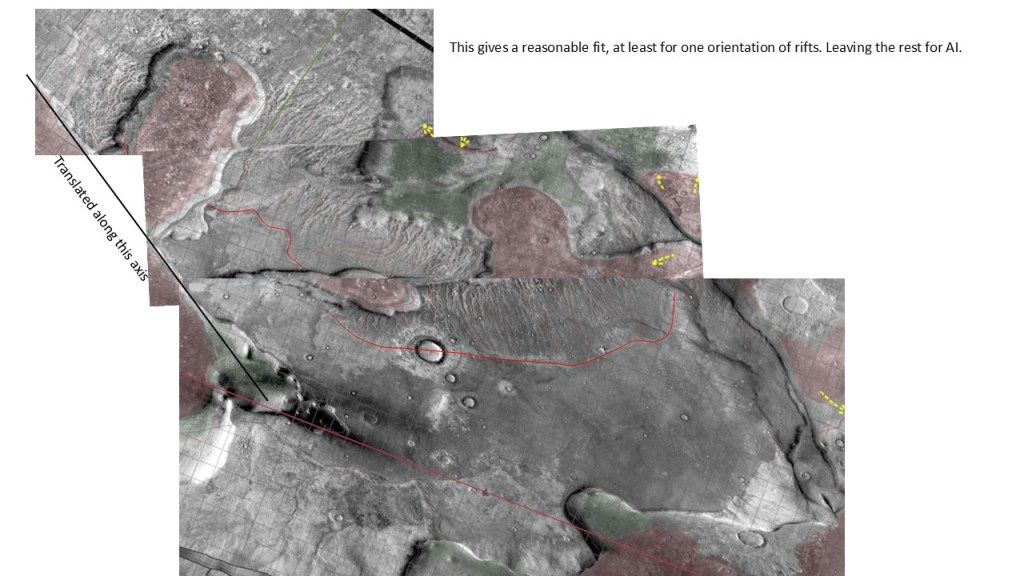
To restore the scoured rafts to their original pre-rift position would mean to simultaneously narrow all the rifts and juxtapose the opposite sides. A monumental task which could perhaps be undertaken by an AI-directed tiling program. Failing that, one might just try some “easy” cases, to prove the point.
Close-up
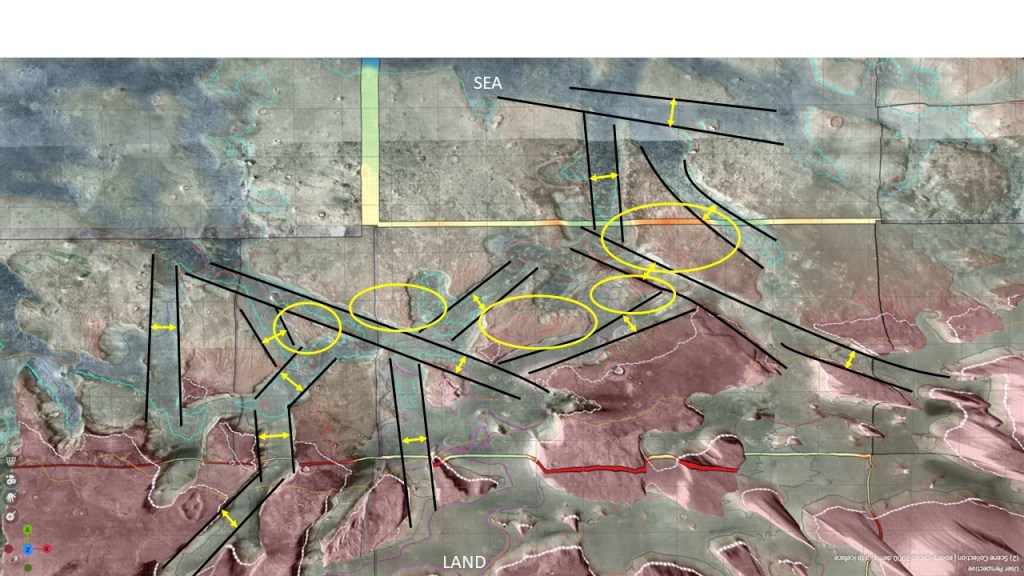
The layout:

Rotation:
Translation:
Farther SW, at the Arabia Terra junction:
And again, a long rift passing though the middle of a mesa, cutting it in two:
…and a reconstruction of the dissected mesa:
Here’s a “brute force” reconstruction of a large portion of the scour trend, like a badly cut jigsaw puzzle:
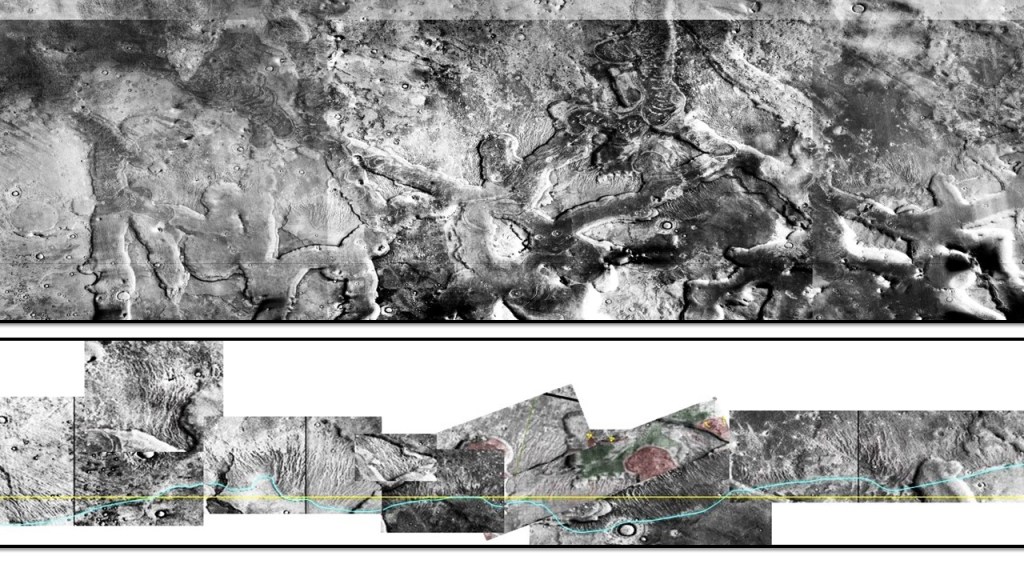
Given that a reconstruction of the ramps/raft would give a fairly linear shoreline trend I think that the icecap model best explains a collection of erosional patterns that extend along strike for upwards of 850km, at roughly the same elevation.
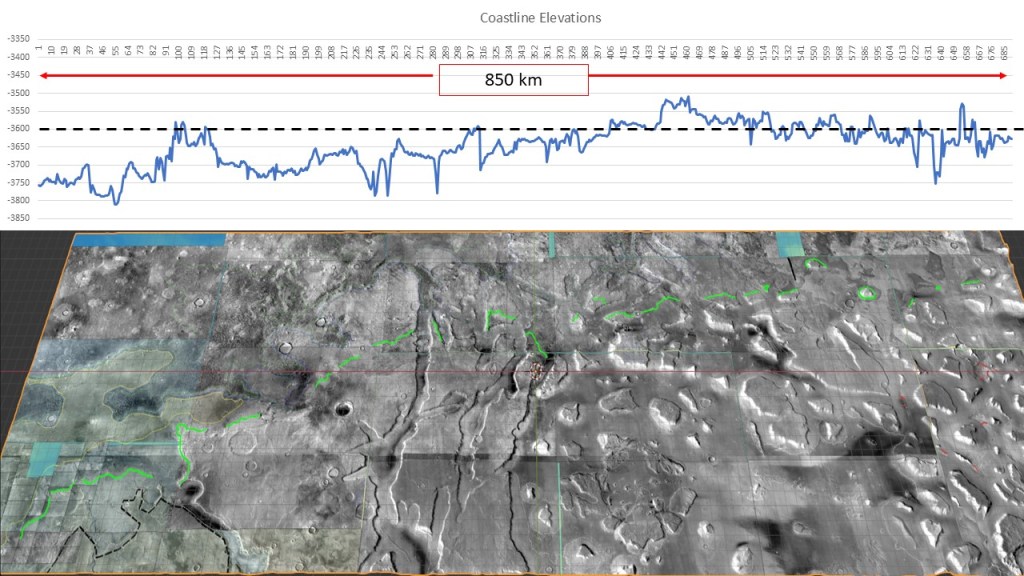
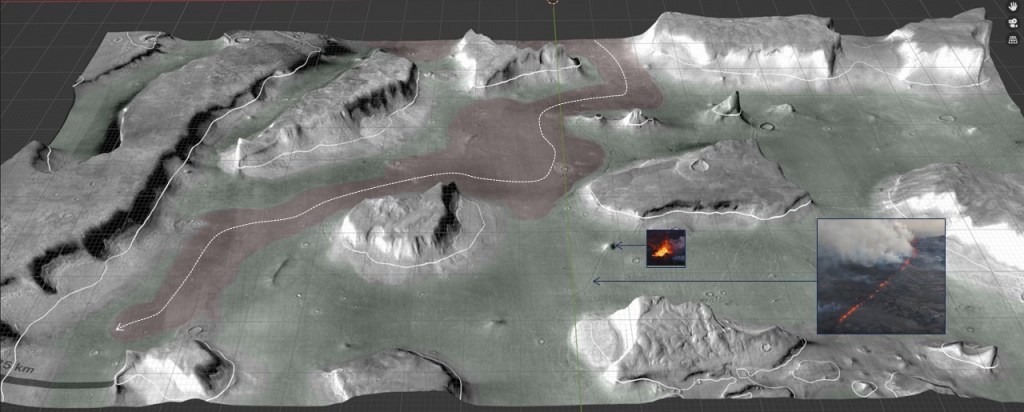
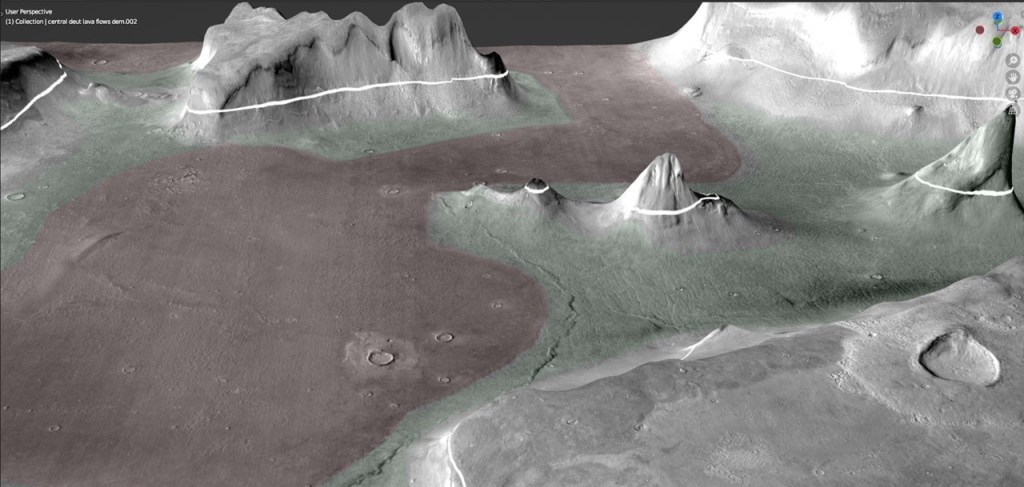
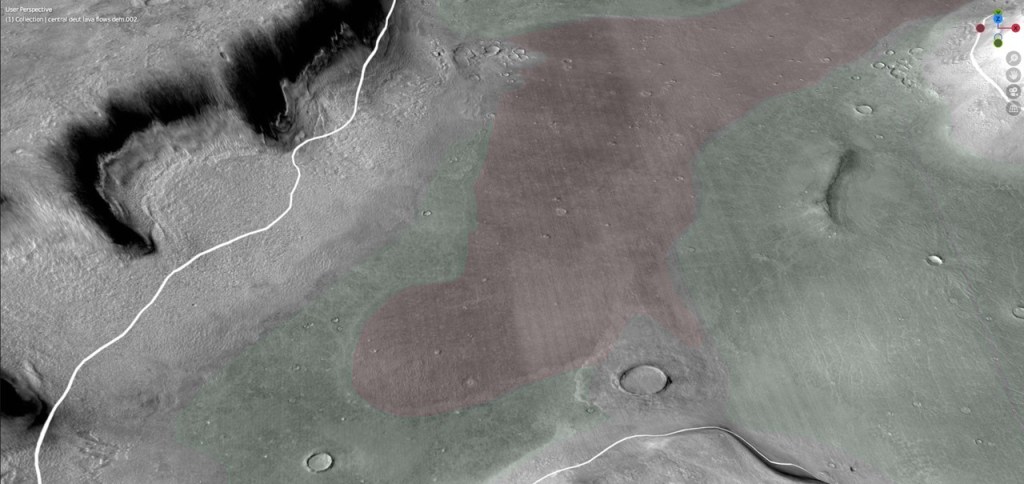
The rifting which scattered the eroded mensae and ramps resulted in extensive lava flows, in two stages: an early one, tinted green, which has a wrinkled “elephant skin” texture, and a later smooth one, tinted red, superimposed and on-lapping the former. Scoria cones and dikes/fissures are in evidence throughout; the younger flow also has numerous pressure ridges between individual pulses of flow. The large volumes of lava extruded formed a lava lake which obscured many of the source fissures. The older (green) lava originally filled all of the rift valleys as well as the up-dip amphitheatre, as it still occupies the edges and the up-dip parts of the valleys; it was then covered by the younger (red) lava.
A northern panel is shown below. North is up.
Detail
A southern panel (continuation of above). North is up.
Detail
Without interpretation, to show I’m not cheating:

To sum up the story so far:
We’ve seen the erosional evidence of a -3600m sea level both on sea stacks and on an indented shoreline on ramps; a dip-oriented pattern of scours extending along ~600 km strike of proposed shoreline, most likely due to glacial runoff (the only viable candidate for a line source that long); evidence of post-erosional rifting and associated lava flows.
Lower Platform Stratigraphy
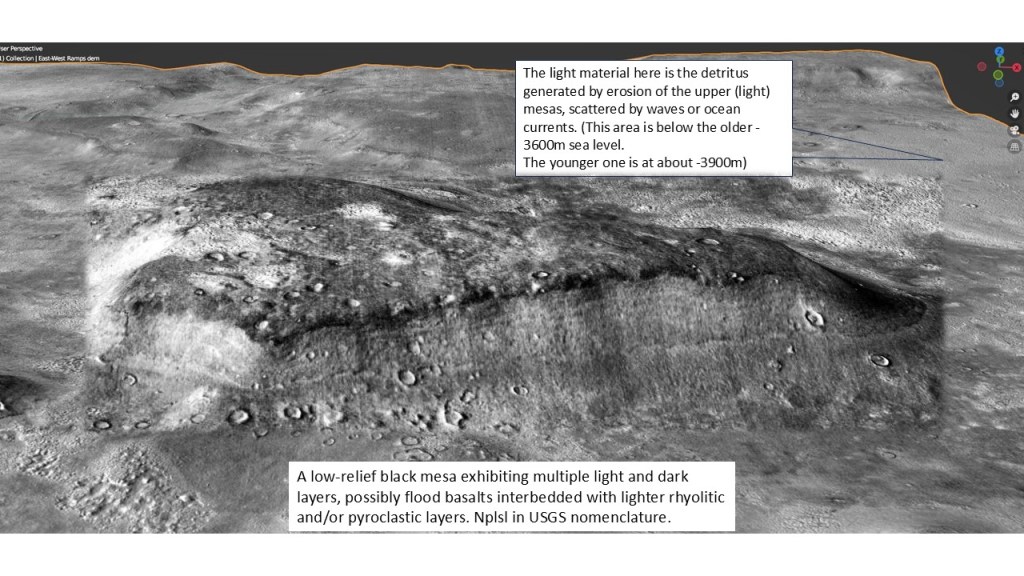
The following is a brief review of the plateau rocks, mensae and ramps. They are divided into two categories: Noachian Plateau Smooth Upper and Noachian Plateau Smooth Lower distinguished by their reflectivity, i.e. light upper (felsic) and dark lower (mafic).

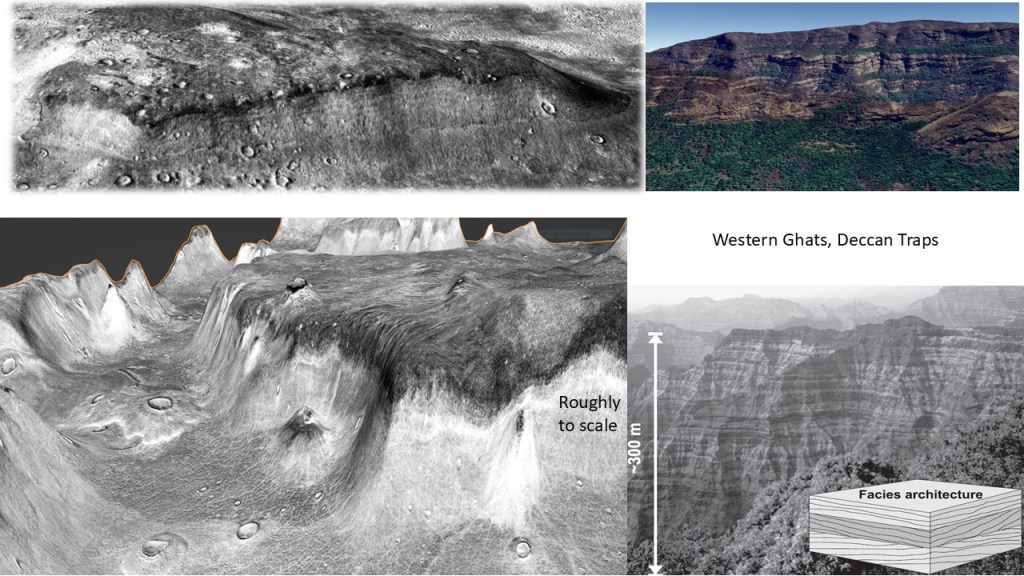
Analog from a Large Igneous Province on Earth:
Erosion and Weathering
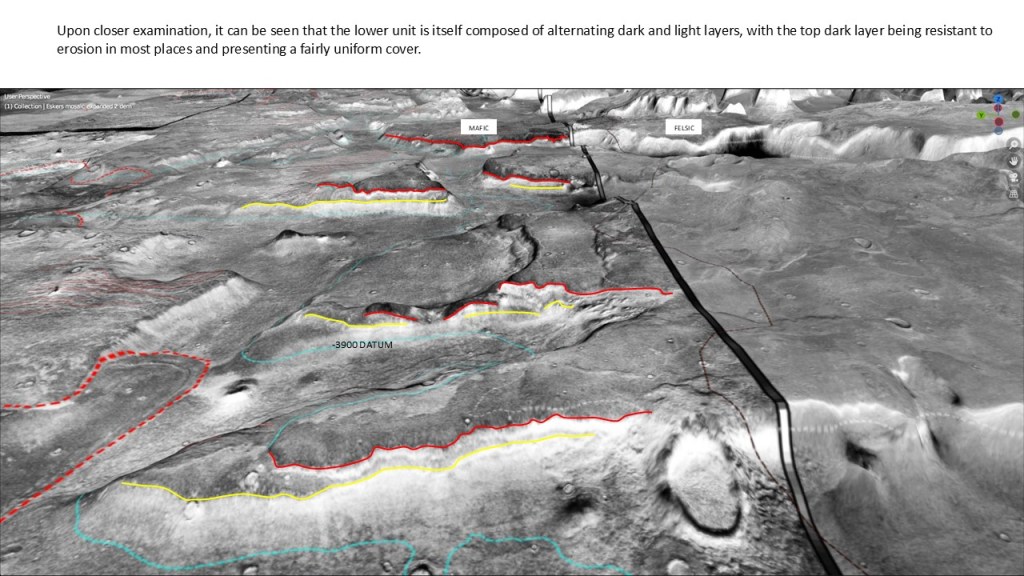
Rainfall, rivers, and glaciers played a role in the removal or bevelling-off of the upper plateau rocks, exposing the lower strata as illustrated below. Additionally, wave action cut into the lower unit to produce a shoreline, and glacial runoff scoured the dark basaltic rocks, exposing lighter strata beneath them
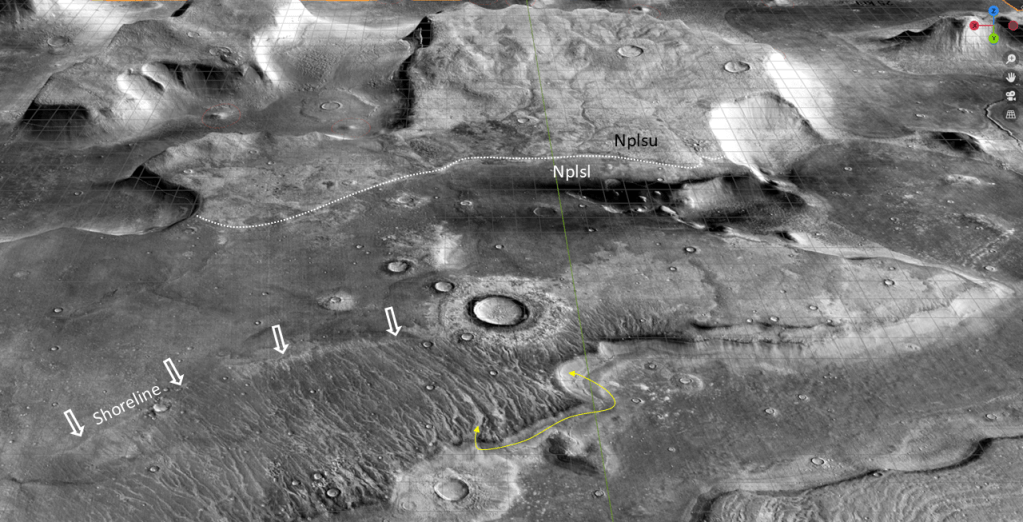
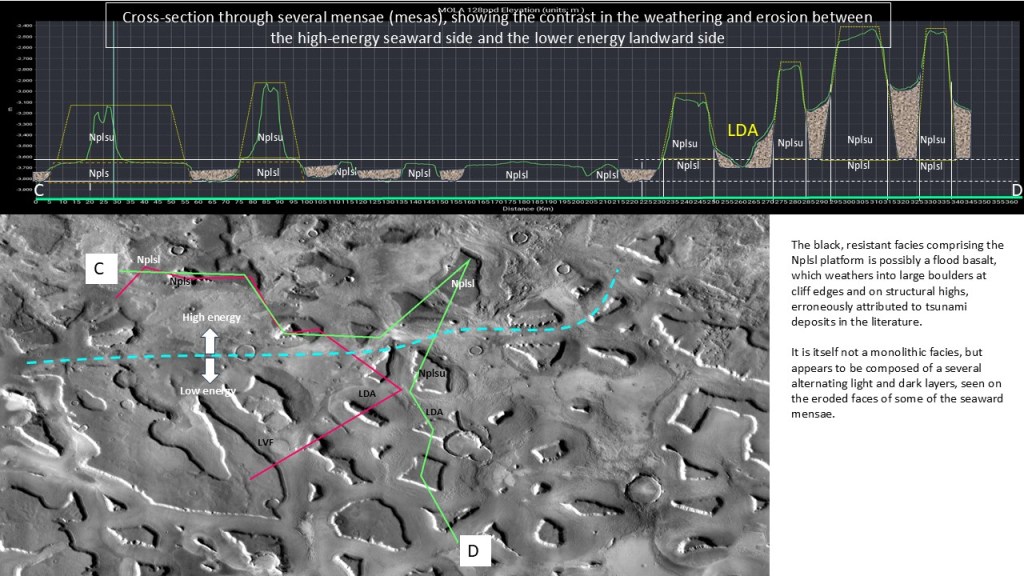
Now, here is a somewhat controversial topic: the dark rocks have been hypothesized to be tsunami deposits, thrown up onto the ramps by huge waves, forming lobes which were then channelized by the backwash. However, inspection of the image above shows the dark rocks to extend well above the high-water line of the purported tsunami, which I am calling the shoreline. Higher resolution images reveal some of the dark rock to be in the form of large boulders which are supposed to be clastic materials transported upslope by the tsunami wave; I take them to be products of mechanical (warm/cold cycle) in situ weathering products of the basaltic rocks, as they are concentrated on ridges, highs, and cliff margins where reduced horizontal confinement allows for expansion. (In the glacial runoff areas, there were likely also freeze/thaw cycles). The lighter rocks in the channels are actually the strata underlying the eroded basaltic rocks.
This completes the discussion of the -3600 shoreline, from Isidis Basin to Utopia Basin to the Deuteronilus Coast, with all the excursions into matters of erosion, weathering, an icecap, rifting, lava flows and sea level changes. Call it Ocean36.
Now the discussion turns to a lower, younger, sea level at about -3900m. Call this one Ocean39.
Deuteronilus -3900 Shoreline
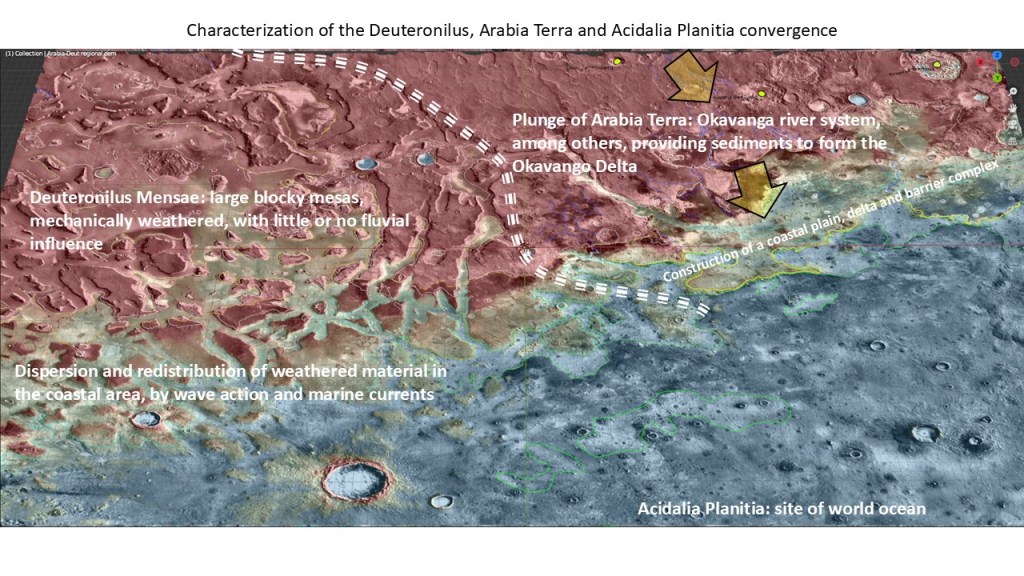
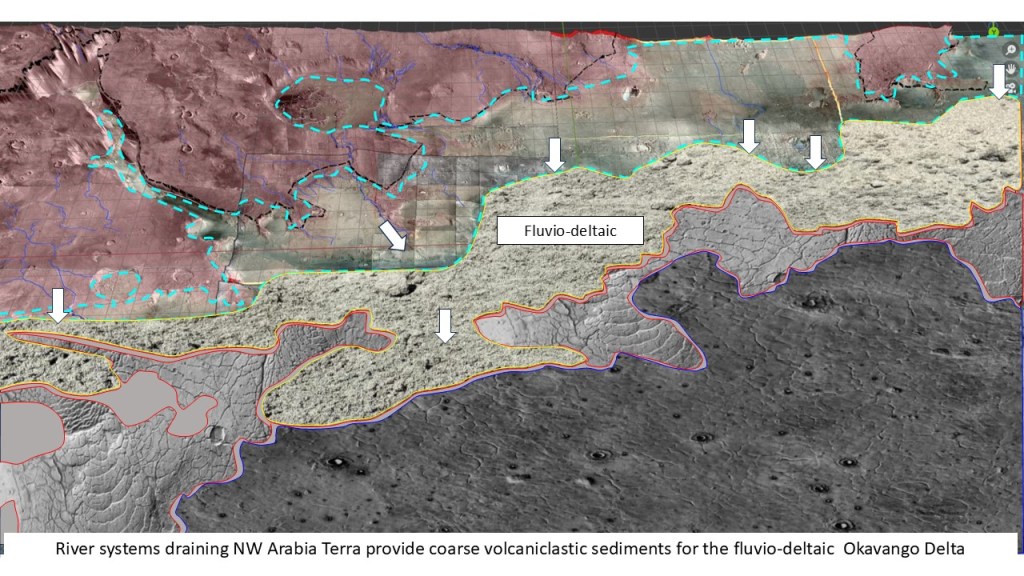
A cursory look at the transition from Deuteronilus Mensae to Arabia Terra reveals a marked difference in the respective terrains: DM is composed of a multitude of blocks (mensae) of different sizes, from mesas to ramps, whereas AT is a simple monocline of plateau rocks dipping down to the northern basin. The former is discontinuous, and shows little or no evidence of fluvial influence; the latter has the extensive Okavango Valles fluvial system at its head.
The DM area is exclusively characterized by erosion of bedrock; the AT area by sedimentary processes. The Okavango River system has all but obliterated the older -3600m shoreline, but compensated by imposing a fluvio-deltaic system with the -3900m shoreline of the younger Ocean39.
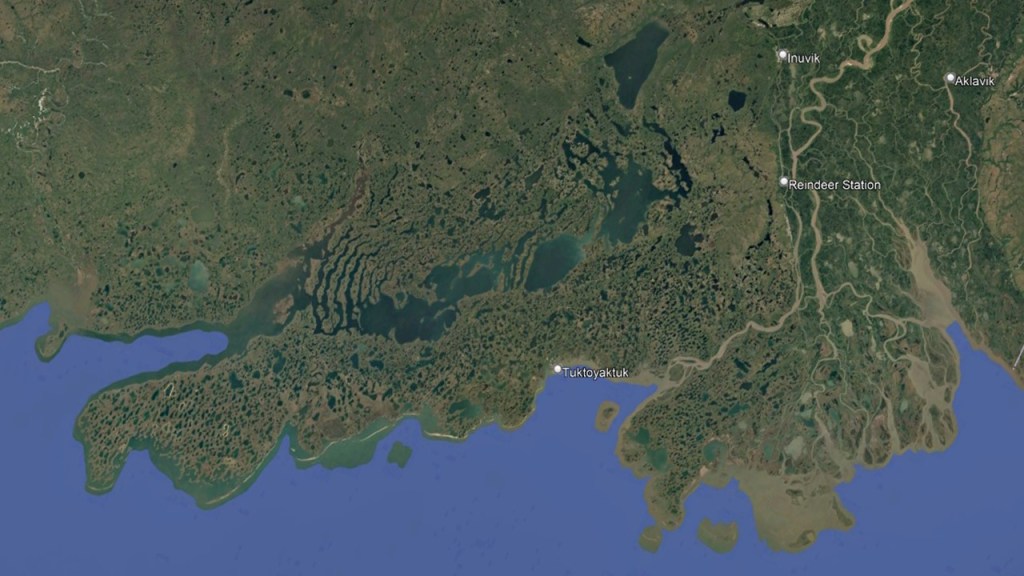
Mackenzie Delta Analog
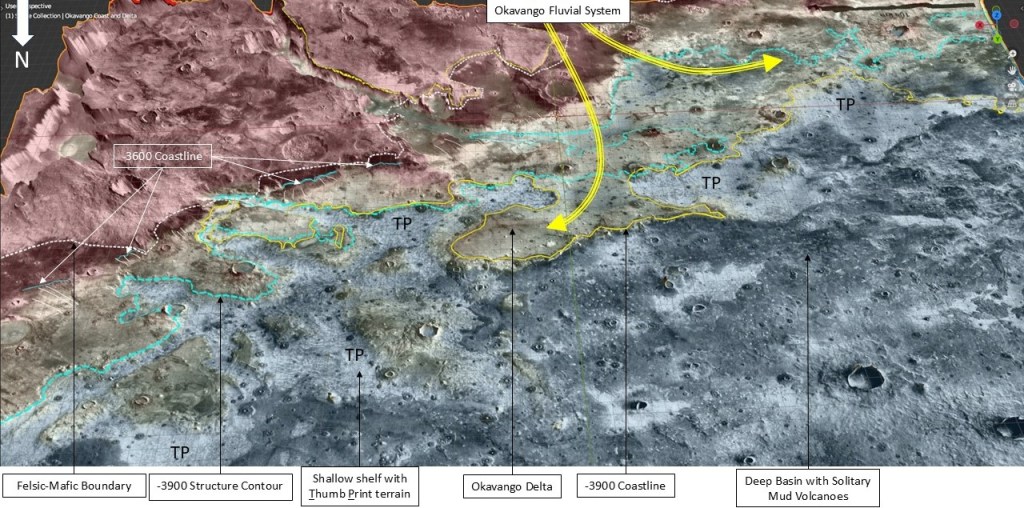
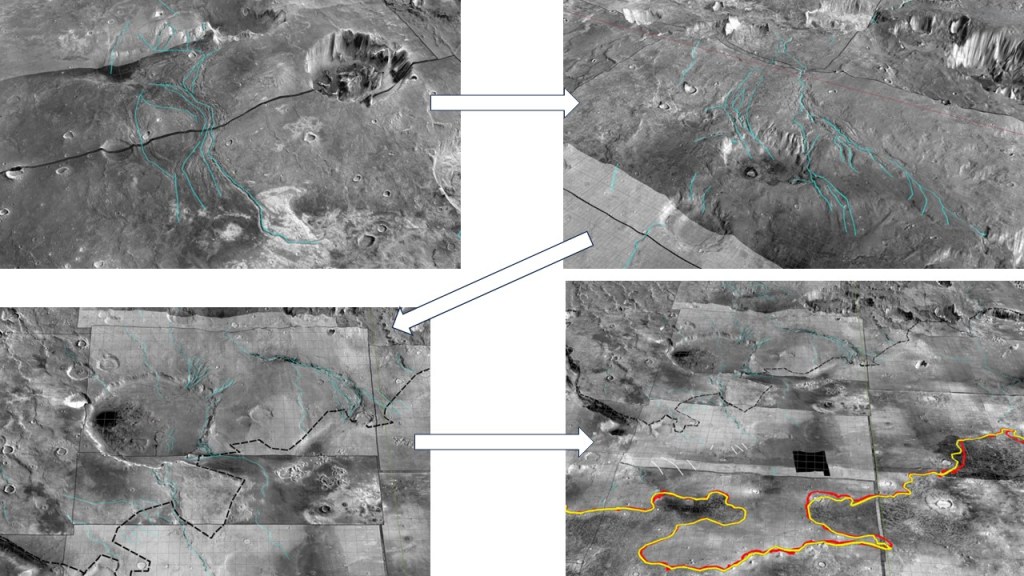
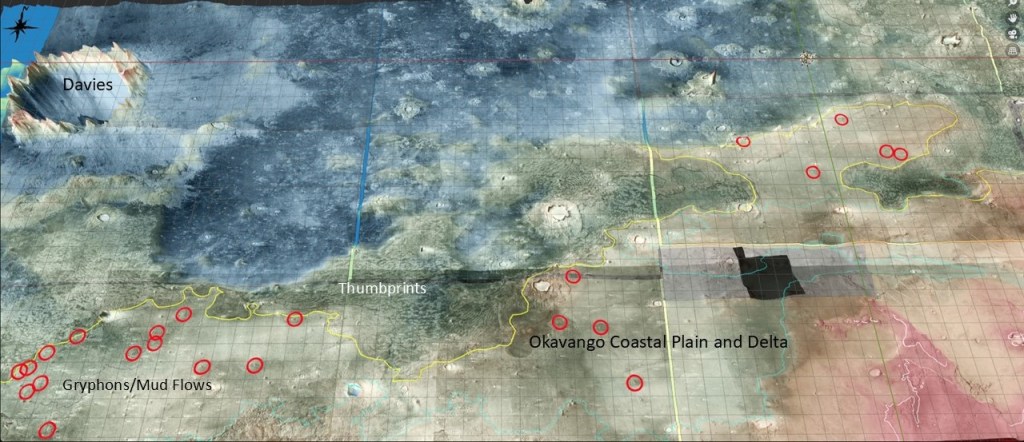
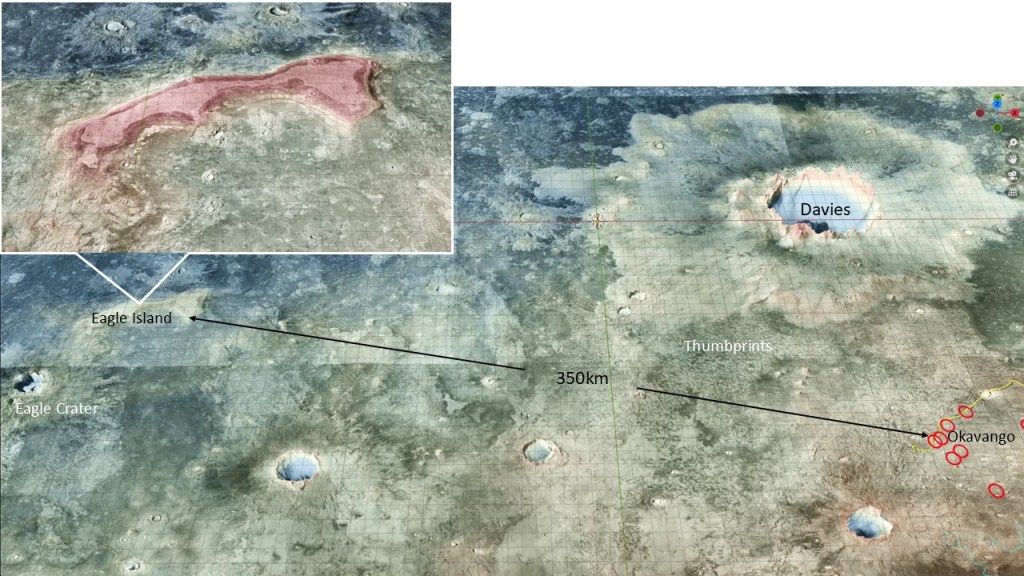
The extensive Okavango River system (too long to fit into one image)
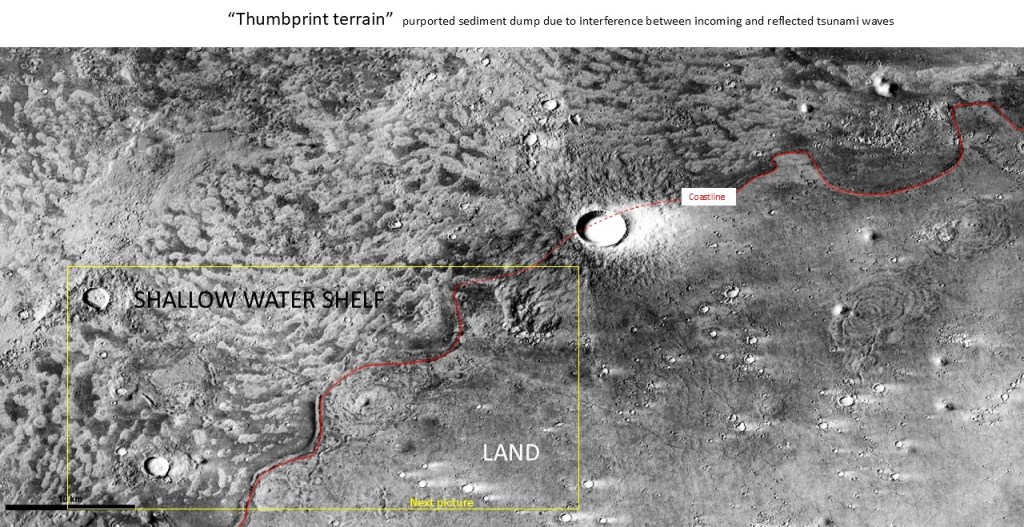
A snapshot of the NE end of Okavango Delta showing land, a shallow shelf with mud volcanoes and thumbprint terrain, and a pronounced shoreline
A closeup of some thumbprint terrain
A closeup of a shoreface sand
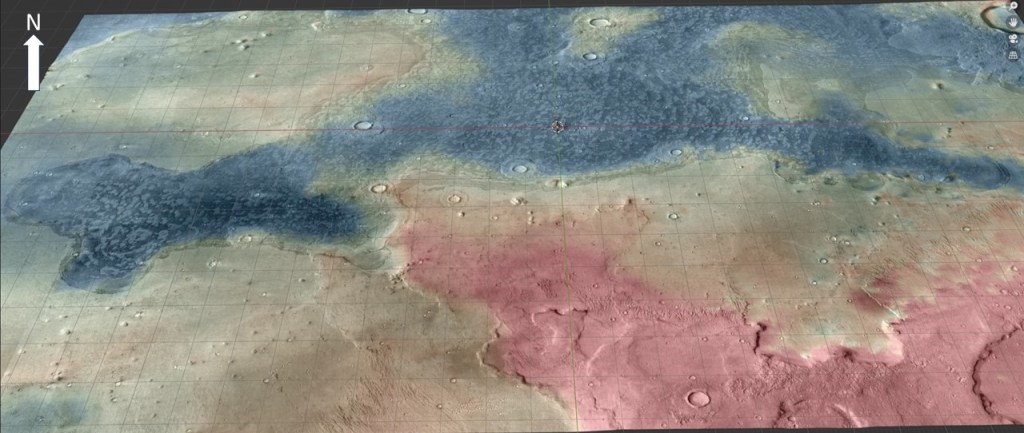
A view across the Okavango Plain and Delta:
…and to the West, an offshore island, adjacent to Eagle Crater:
That is probably as good as it gets for a definition of a shoreline. Now I’d like to enter into a lengthy digression into some other marine indicators, namely extruded over-pressured muds. Following that, the Ocean39 shoreline discussion continues.
Mud Volcanoes, Thumbprint Terrain and other manifestations of over-pressured volatiles
I have alluded to thumbprint terrain and mud volcanoes as indicative of marine environments several times and will try to expand on the subject.
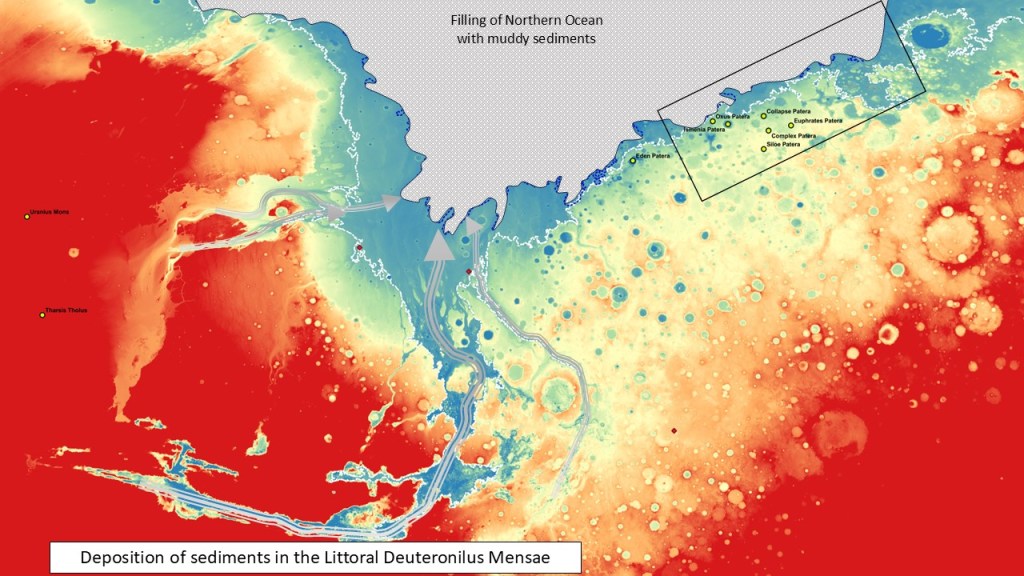
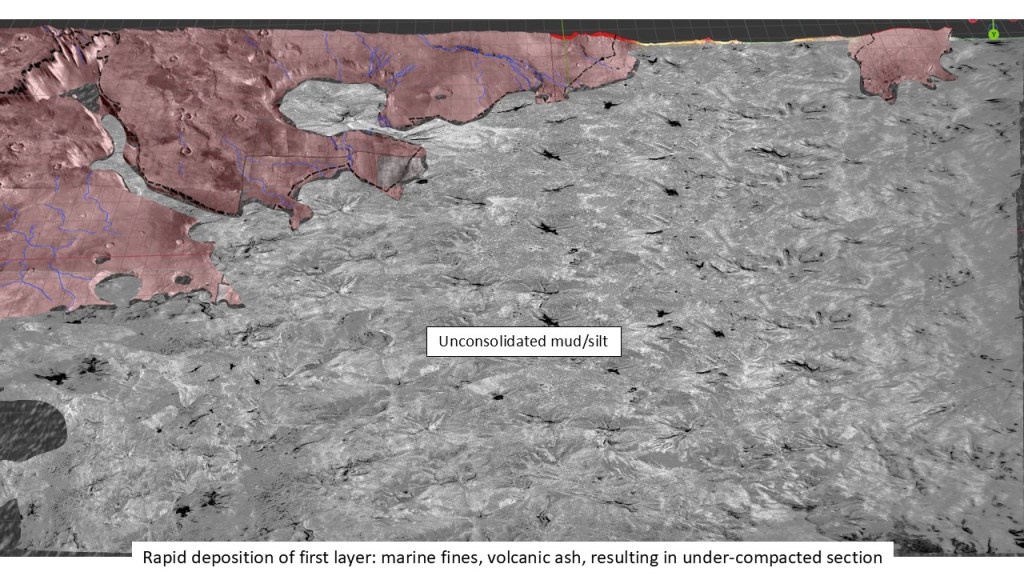
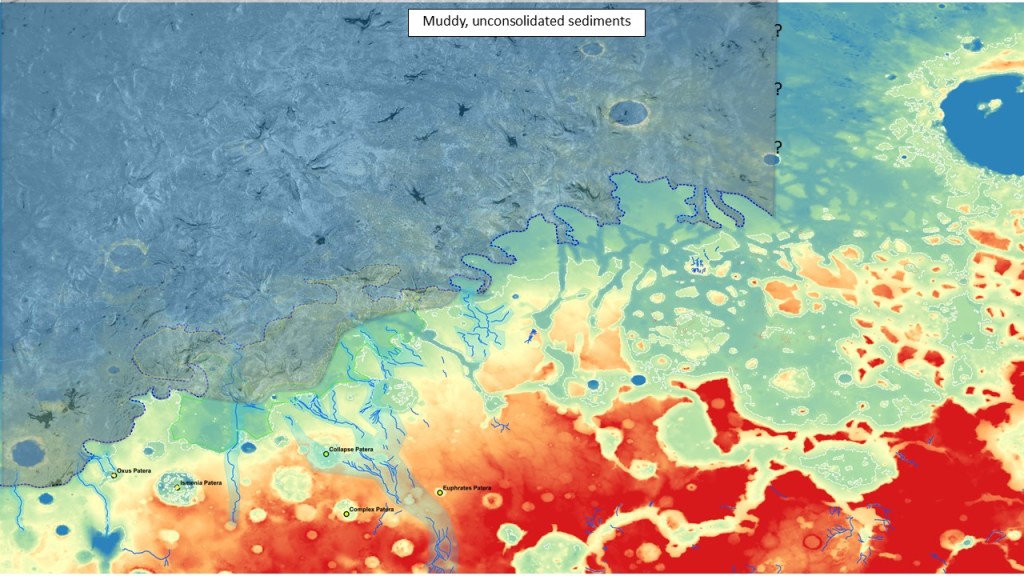
To set the stage for the widespread occurrence of extruded volatiles in large parts of Acidalia Planitia, Isidis Planitia, Utopia Planitia and offshore Deuteronilus, we posit a huge and rapid discharge of fine clastics (mud) from various outflow channels, of which the Valles Marineris System is one example. These sediments were carried in suspension over large distances, and after settling out were buried too quickly to expel all their interstitial water, similar to over-pressured sediments in the Gulf of Mexico.
When the atmosphere was lost to space, the water/ice sublimated away, lowering the overburden pressure and causing the unconsolidated muds to be squeezed up to the surface.
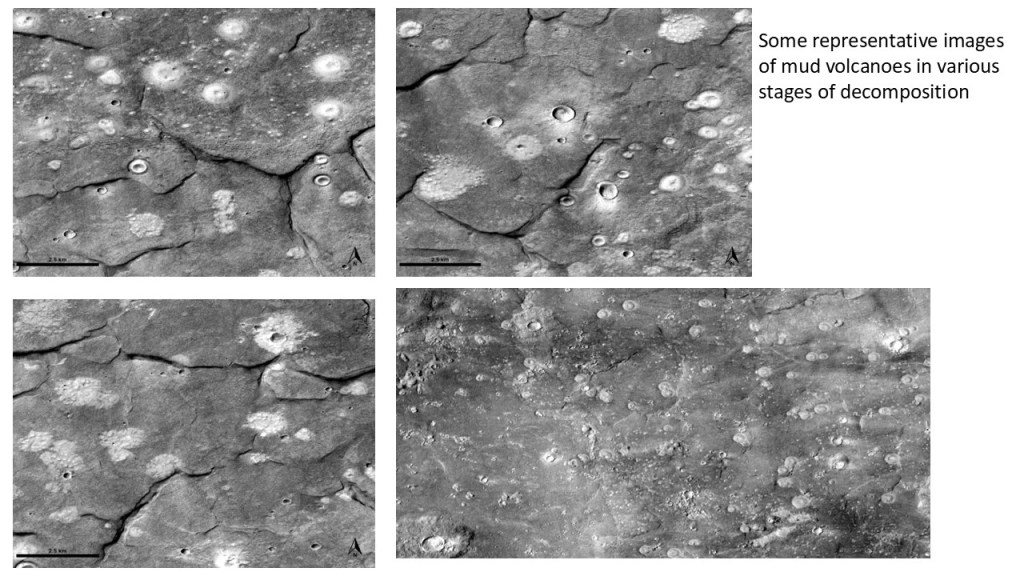
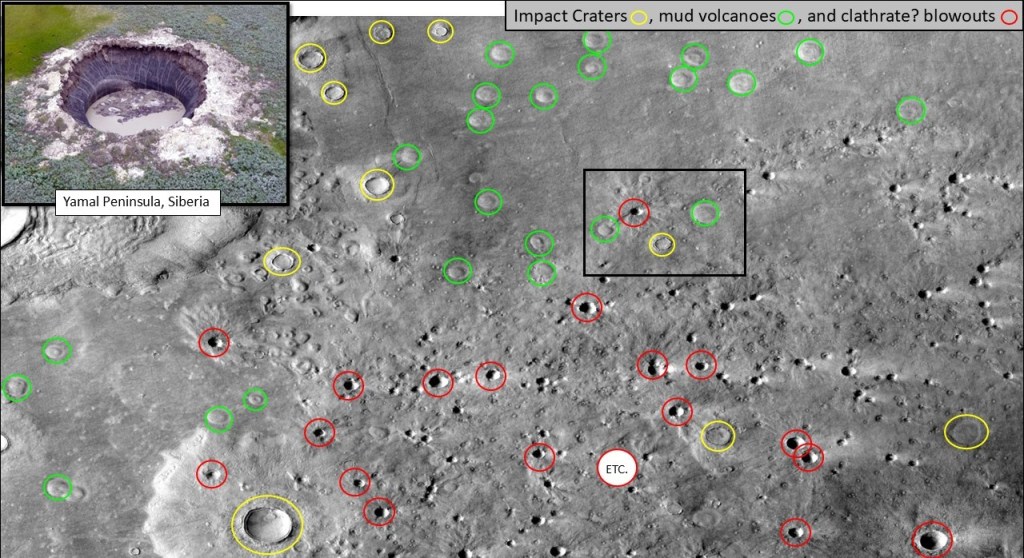
A simple expression of this phenomenon are solitary mud volcanoes which are ubiquitous in Acidalia, Utopia and Isidis Planitia; they sometimes follow polygonal cracks (de-watering or ice expansion?) which act as lines of weakness, but mostly penetrate the caprock directly.
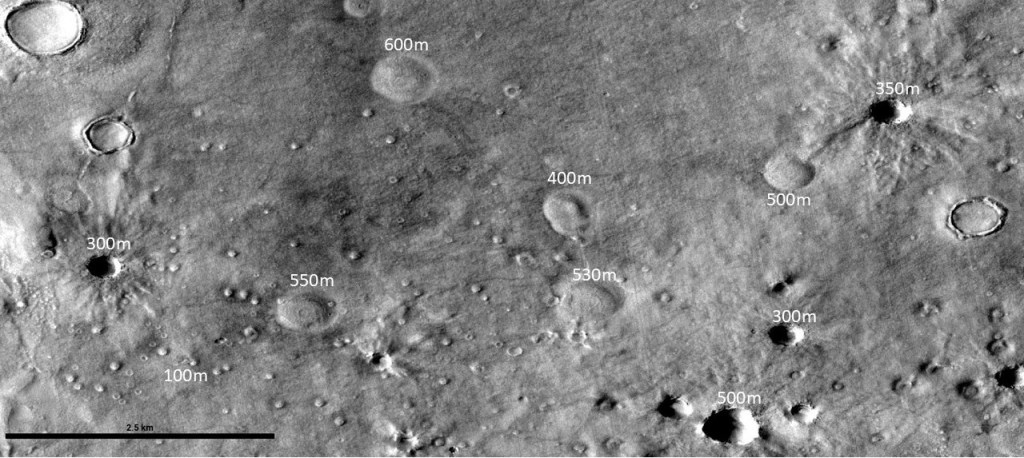
Closeup of various MVs with measured diameters below: In this region they come in two size ranges: 400m-600m, and tiny ones, at about 100m; there are also some enigmatic holes, 300m-500m, conical pits that look like they have exploded outwards. They may represent clathrate blowouts, similar to those recently found on the Yamal Peninsula in Siberia, resulting from thawing permafrost. They do not have the rim or centre cone normally seen in impact craters.
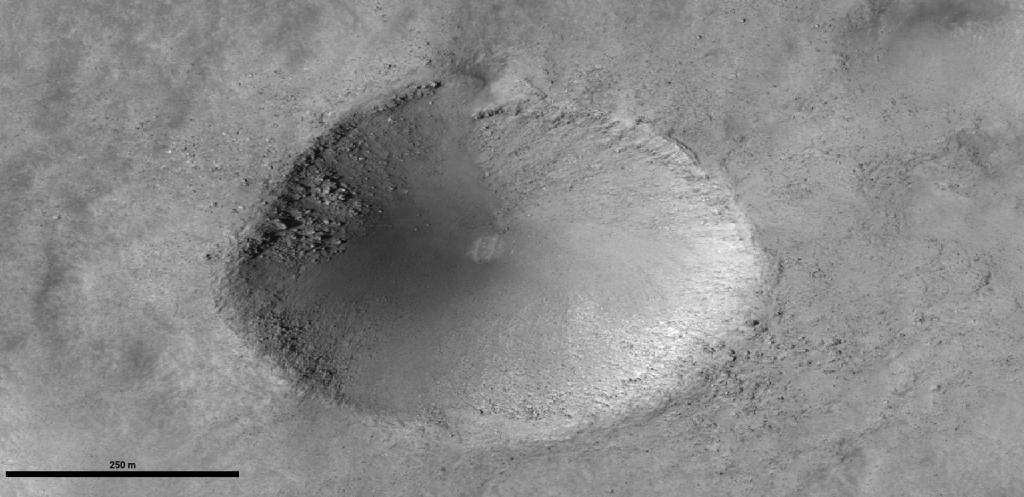
Close-up of “blowout” on HiRISE:
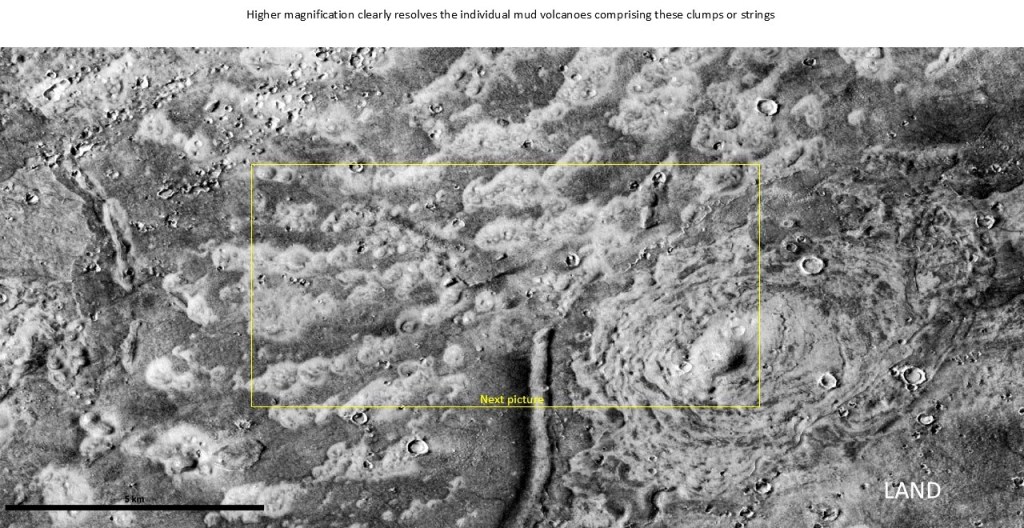
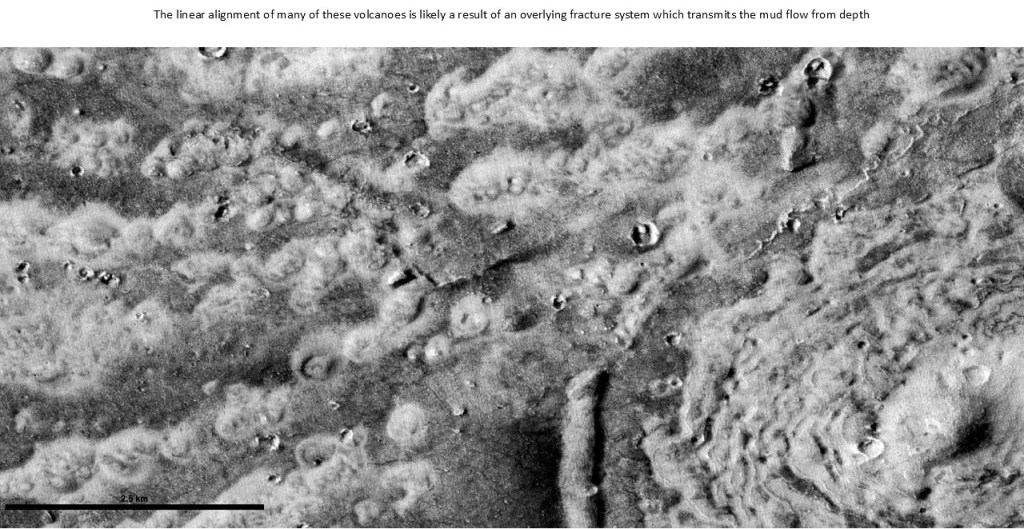
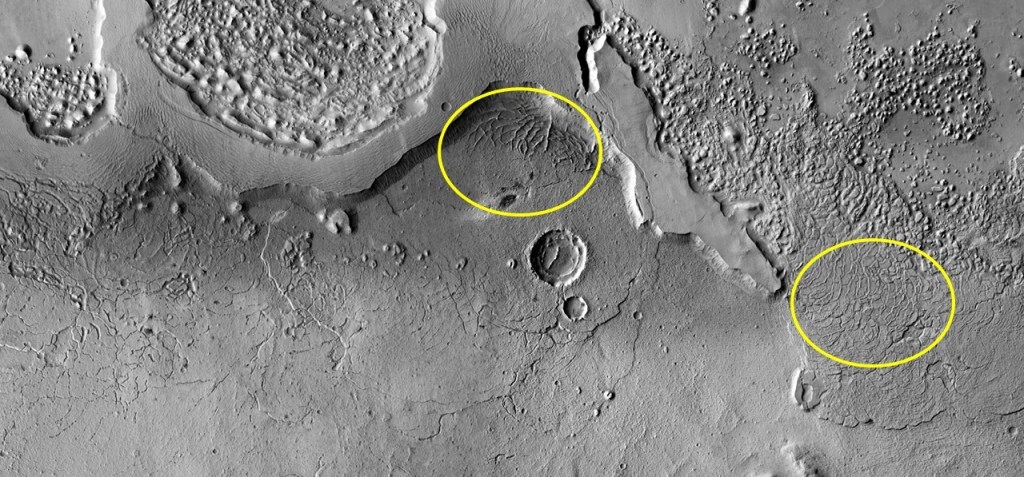
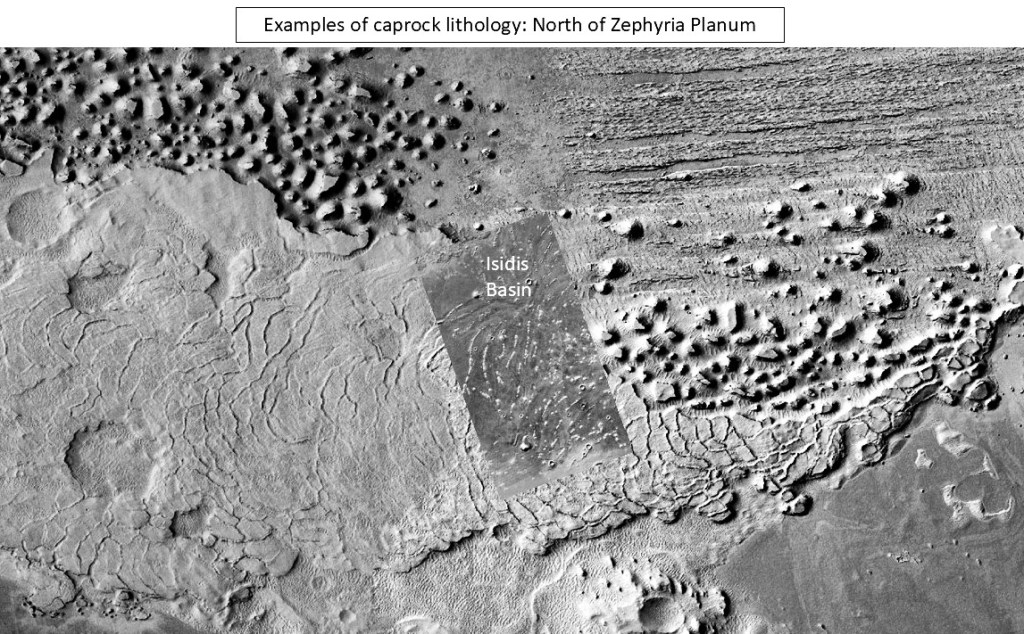
Turning to Thumb-print Terrain: various explanations have been offered for these strange features, from glacial deposits to sediment dumps due to interference between in-going and reflected tsunami waves. As can be seen in the sequence below, magnification reveals them to be lined up mud volcanoes, likely passing through a fractured overburden which effectively filters them.
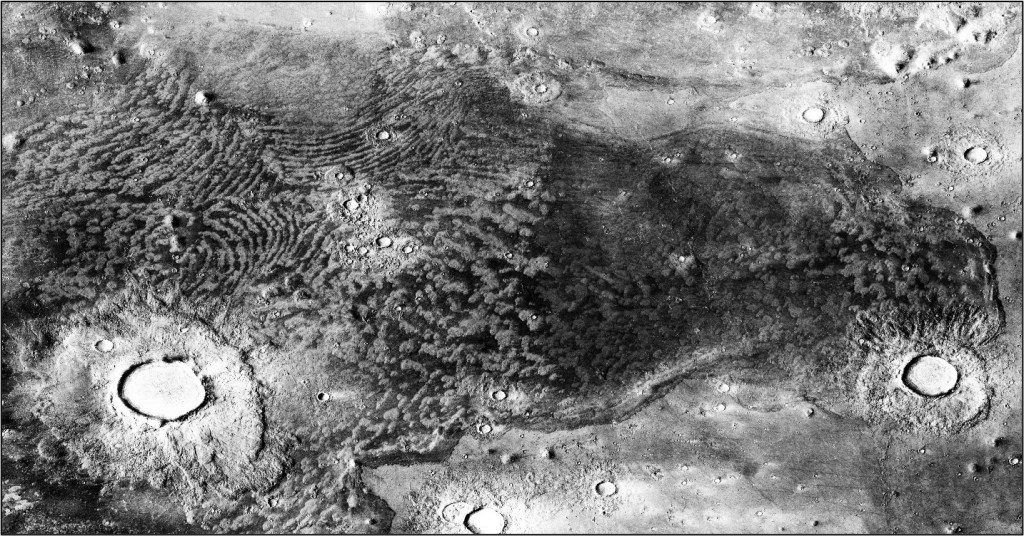
In order of increased magnification:
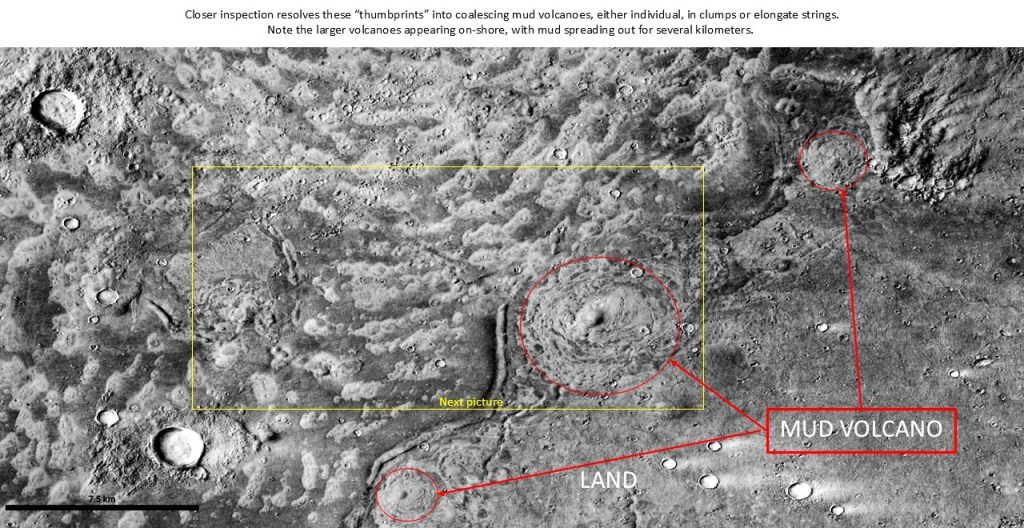
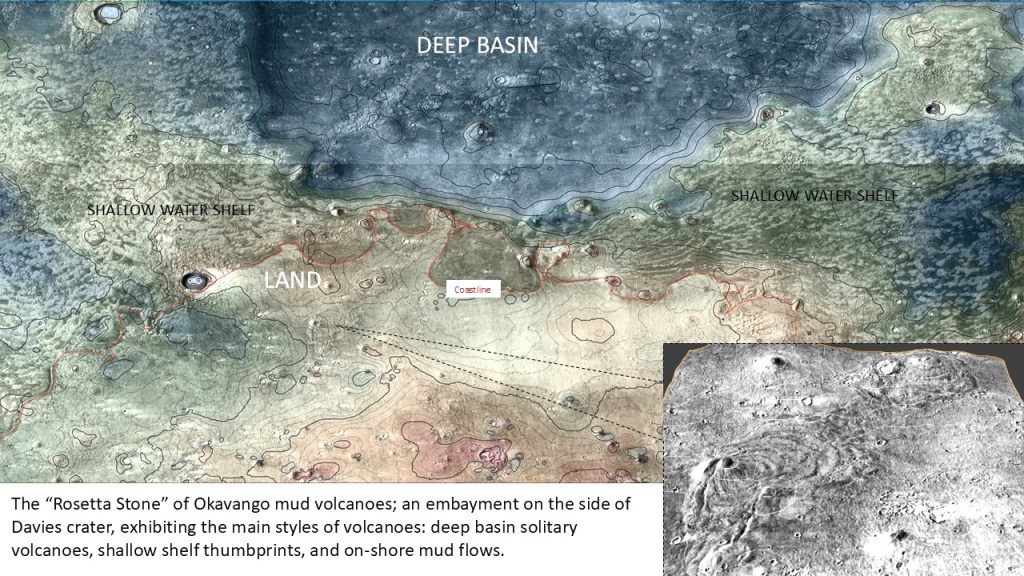
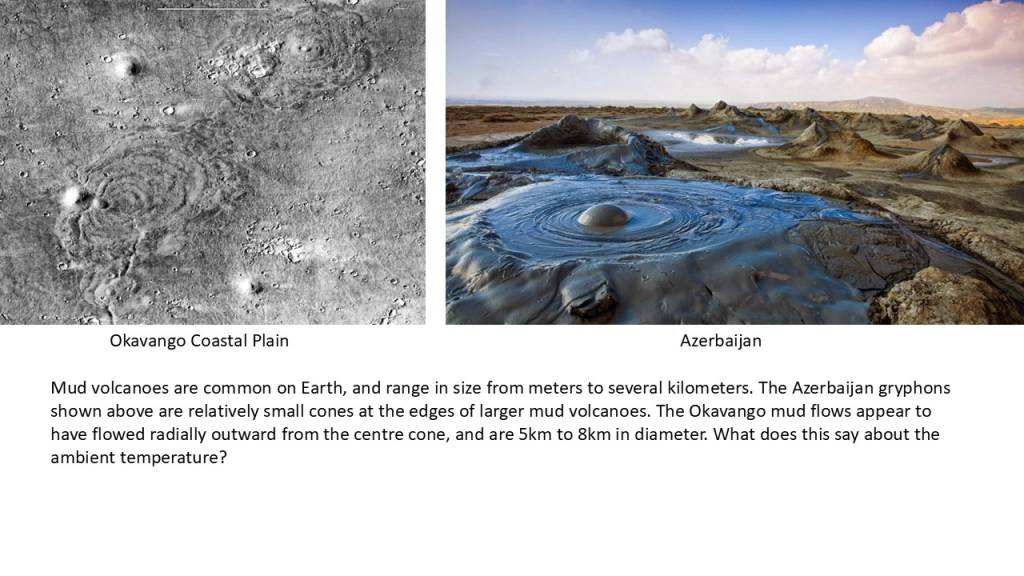
This begs the question of how mud flows can have these different surface expressions. In all three settings, over-pressured mud is being forced up through an overburden, breaking through a caprock with insufficient seal capacity to hold it back. The patterns then, must reflect something of the nature of the caprock: in the solitary MV case, horizontally isotropic; in the thumbprint case, fractured, providing lines of weakness to pass the mud through; and in the massive gryphon/mudflow case, again isotropic, but competent enough to promote pooling at its base, resulting in relatively fewer but massively larger extrusions.
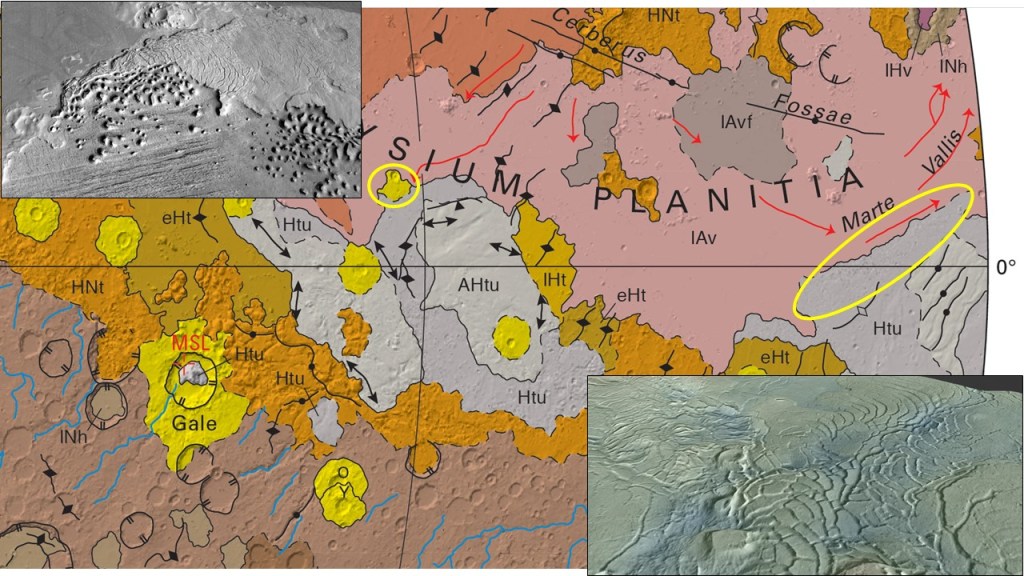
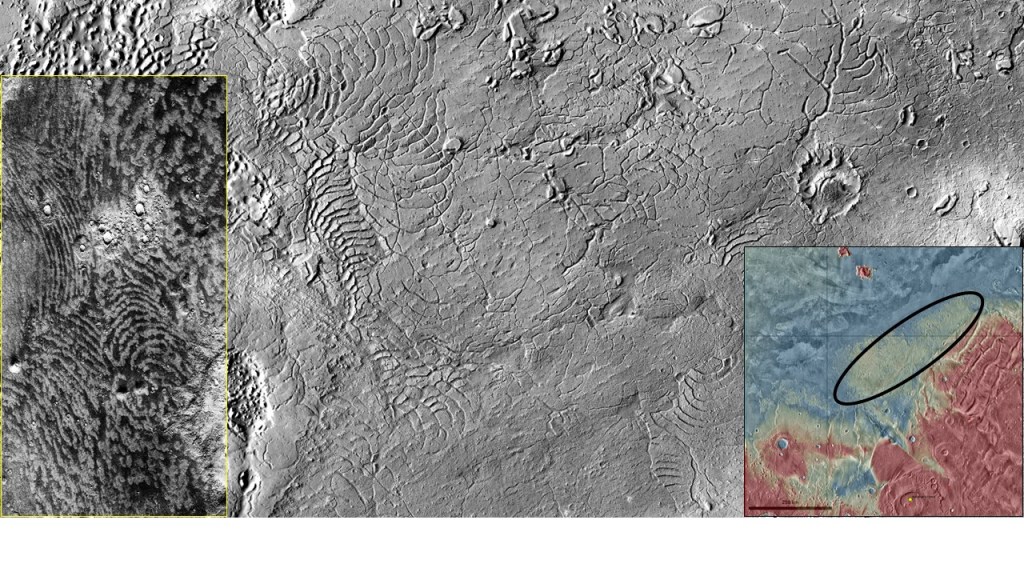
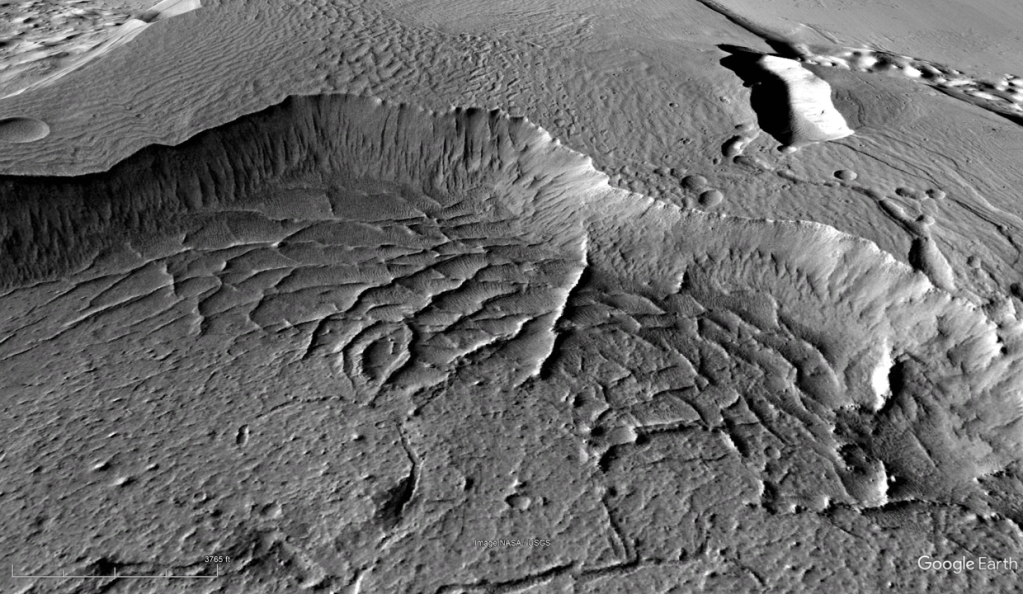
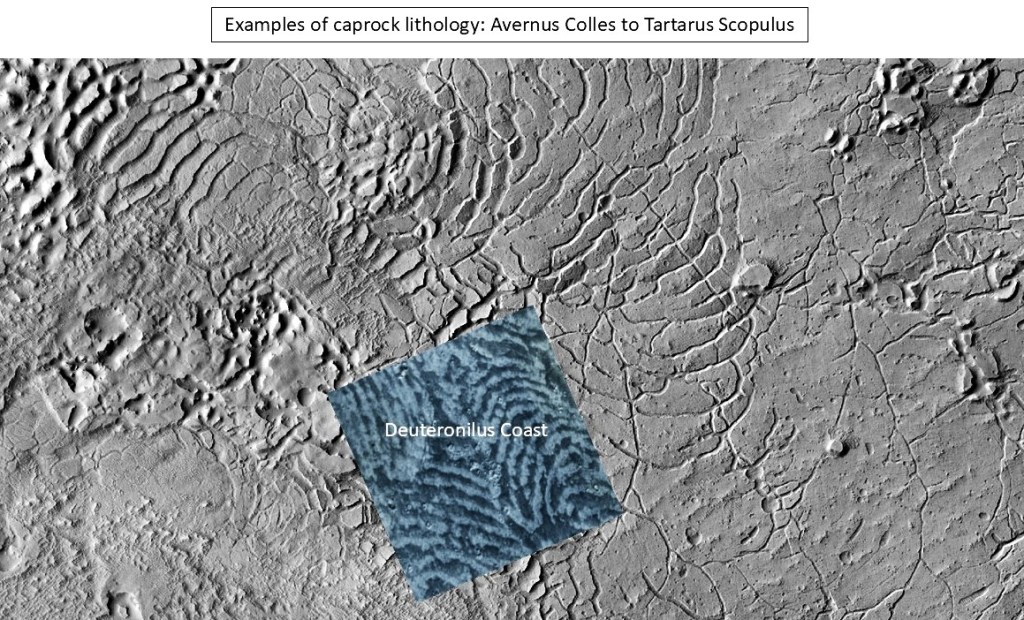
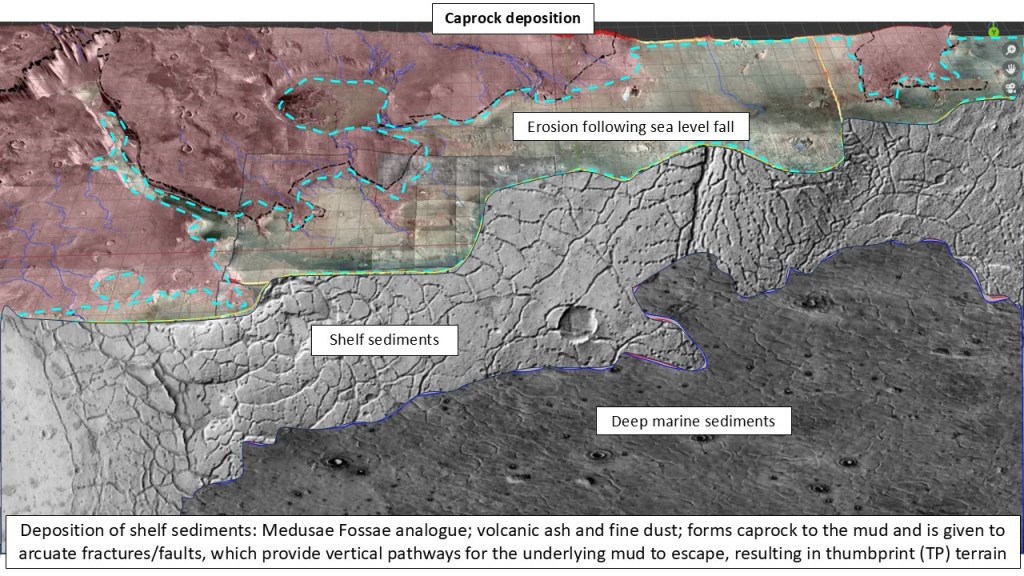
So where do we go for these types of rocks? For the fractured caprock, the other side of the planet gives some hints. Almost 180 degrees to the East lies Apollinaris Mons, and north of it a heavily fractured area called Avernus Colles. The main formation here is claimed to be composed of lava flows because of its platy appearance; however, there are areas containing yardangs nearby making them part of the more friable Medusae Fossae Formation, thought to represent airfall ash/dust or ignimbrites from explosive eruptions. Whatever the lithology is, it lends itself to a very distinctive style of arcuate fracturing which is reminiscent of conchoidal fractures in glass or flint or any fine-grained, amorphous material. Whatever the case, geometrically, the fracture patterns mirror the thumbprint terrains.
Varieties of fractured terrain in Elysium Planitia and Avernus Colles:
Juxtaposition of thumbprints and fractures:
Location map for the next illustration: box on the right side of the image
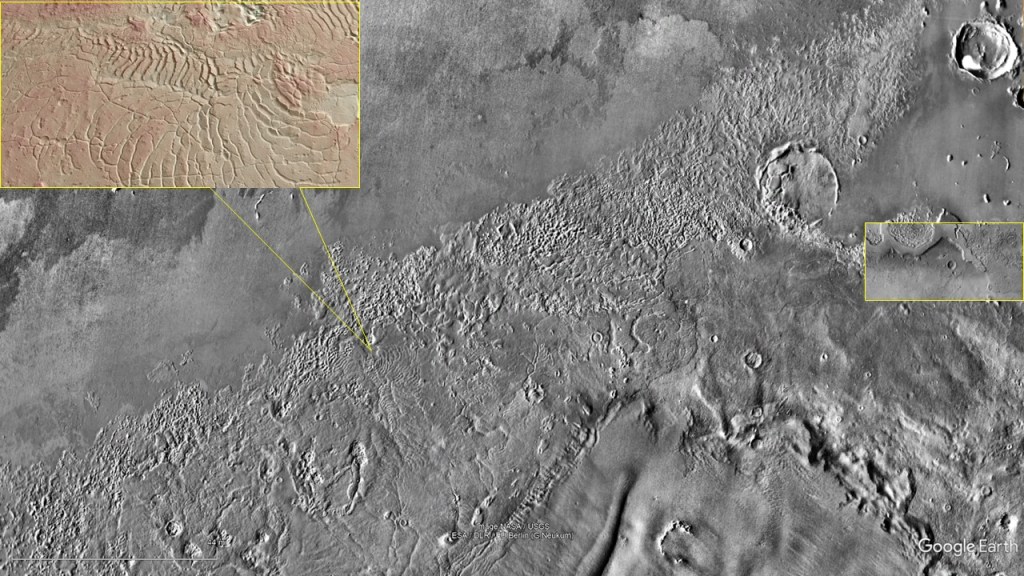
The block referenced above, showing a fracture pattern on the right, and cemented and exhumed fractures on the left. It is uncertain whether these are calcareous or silica cements, or even sandstone “injectites”.
This type of structure was also encountered on Mount Sharp in Gale Crater, and termed “box-work structure”, thought to represent fluid-based cementation of fractures in the phreatic zone.
Some of the ridges below are quite high, and as the scale on bottom left indicates, of considerable length:
Although this is a bit of a digression from the thumbprint discussion, it serves to illustrate how fracture patterns influence the transmission of water, mud, or other volatiles and how they are expressed at the surface.
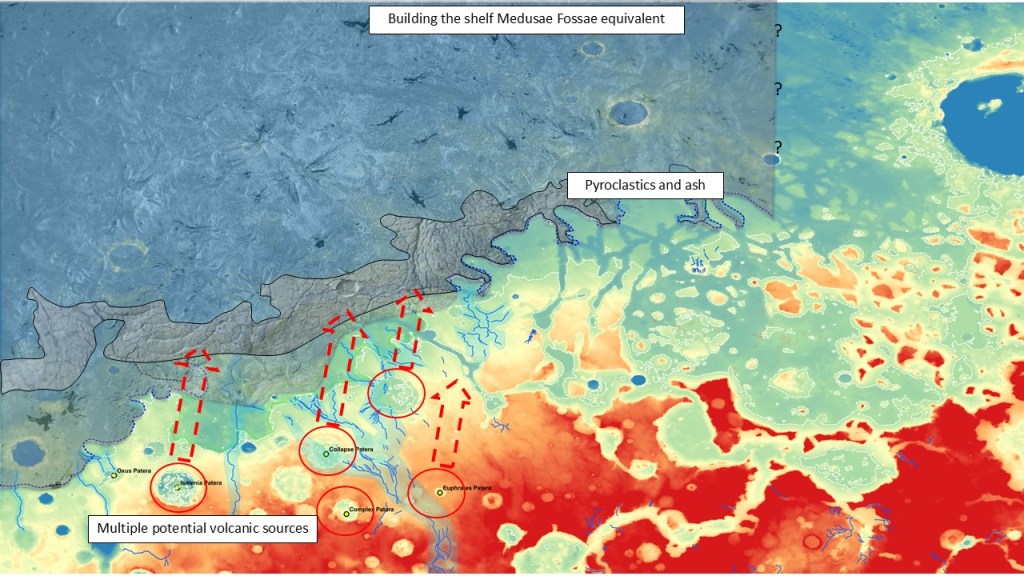
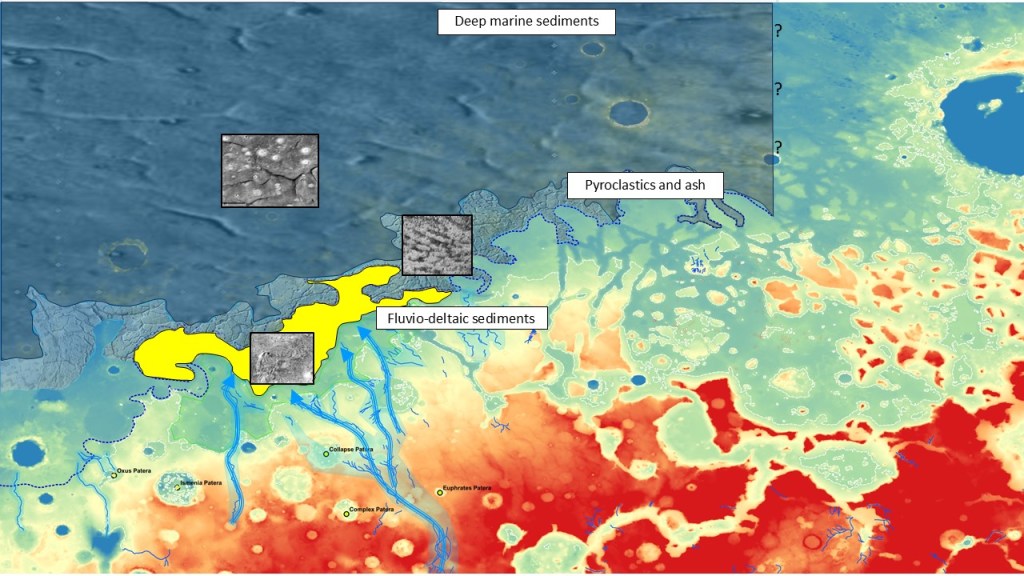
The development of the thumbprints is postulated as follows: the fine, silty/muddy sediments were rapidly flushed into the northern basin by catastrophic floods, and subsequently covered by normal marine sediments; at a later point in time, explosive volcanism deposited pyroclastics and ash in the near-shore shelf zone. This layer, upon lithification, fractured into the unique patterns seen at Avernus Colles (and the thumbprint terrain elsewhere). In deeper parts of the basin it was attenuated and dispersed by ocean currents which is why the thumbprints only occur relatively near the shore. As the mud was mobilized, it was filtered through the fractures, yielding the same pattern at the surface.
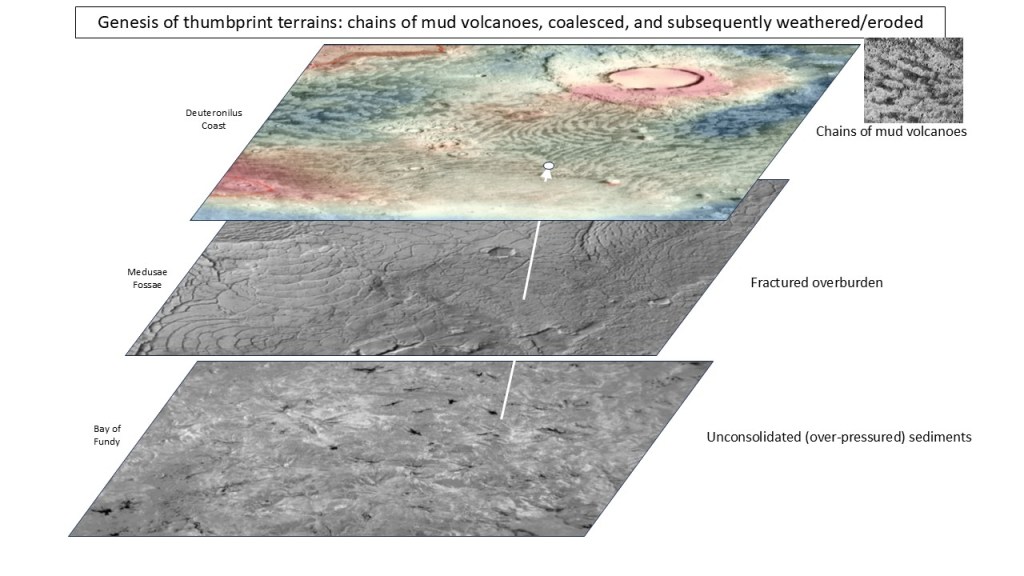
The gryphons and large mudflows were mediated by a more competent overburden in the form of fluvio-deltaic sands. These caused a greater buildup of pressure before releasing the mud ponded beneath, and resulted in much larger volumes expelled at each site. The surface pattern attests to radial flow from the centre and the great areal extent raises questions about the duration of these flows and the ambient temperature. Some of these flows extend over 50km^2 and dwarf the recent Sidoarjo Mud flow, “Lusi”, in East Java, Indonesia, with its mere 7km^2.
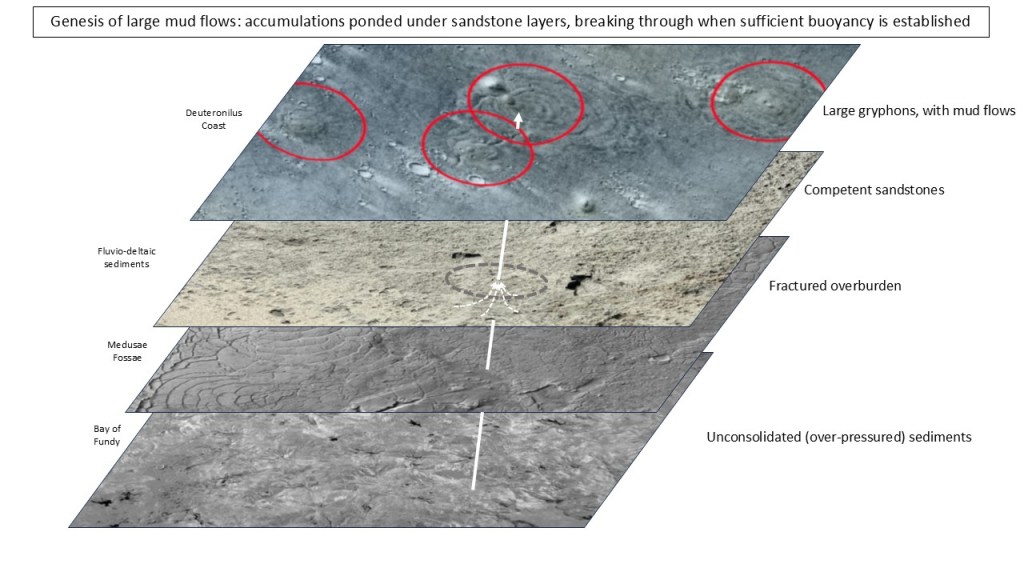
Reconstructing the depositional sequence:
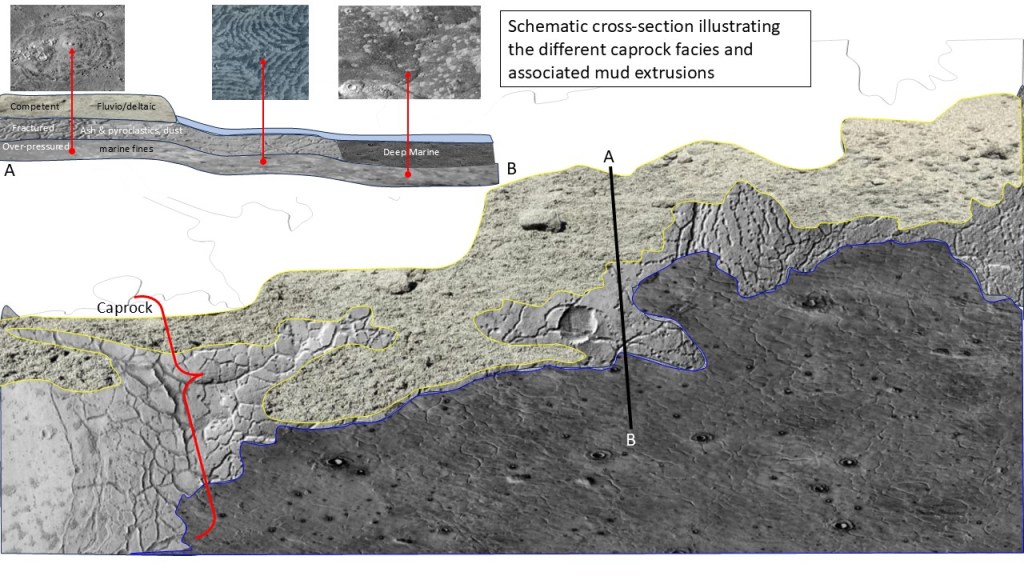
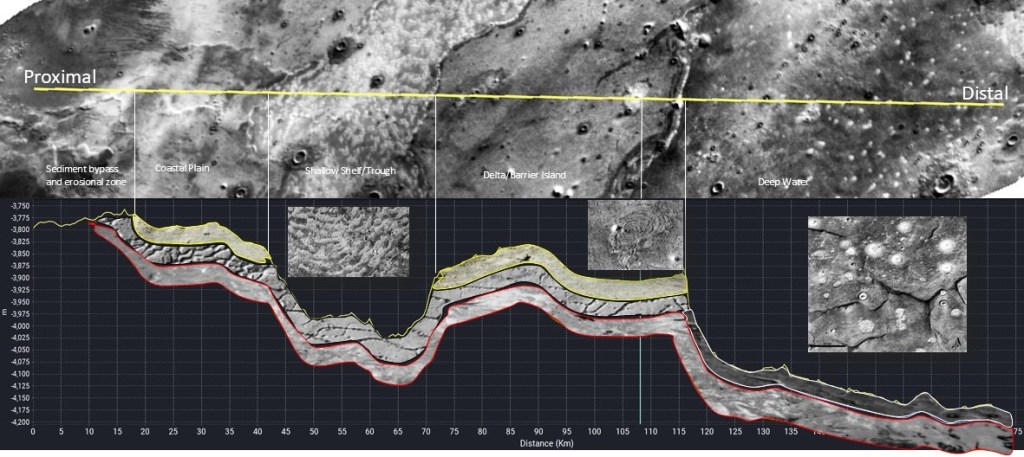
A transect across the various physiographic features: coastal plain-shelf-delta-basin, from proximal to distal.

Reconstruction of the subsurface along this transect, and the resulting expressions of the mud extrusions:
To recapitulate, mud volcanoes come in three styles: solitary, thumbprint and massive flows. At the Deuteronilus coast, the big picture:
Phase 1:
Phase 2:
Phase 3:
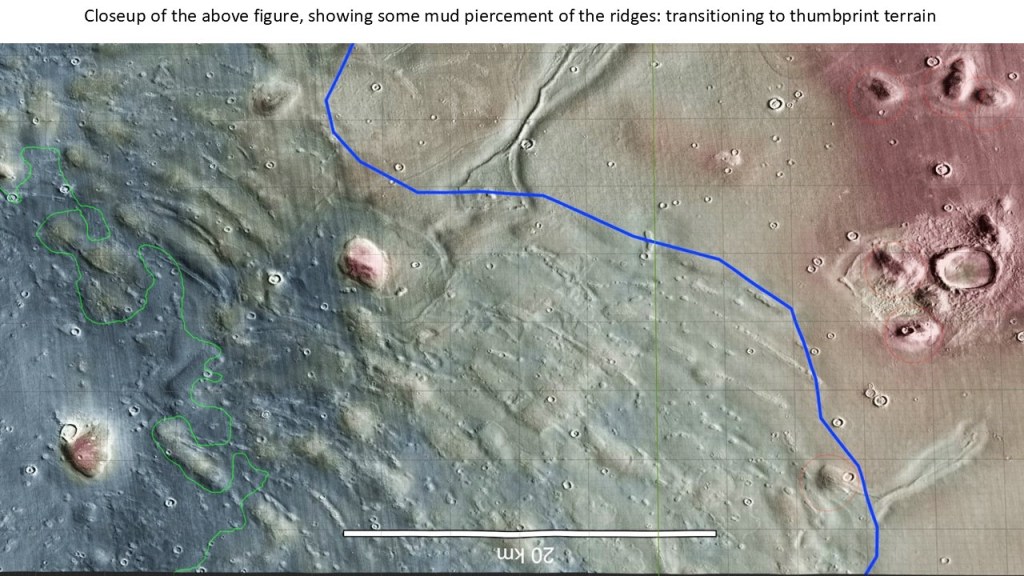
Additionally, in certain situations, such as on a slope, the mud can be subject to diapirism, similar to terrestrial salt or shale diapirs. In the Utopia Basin it forms ridges just below the shelf break, possibly initiated by incipient gravity faulting. As an extensional fault develops, the mud gets squeezed up along the fault plane and, through its buoyancy creates a ridge in the overlying sediments. It eventually can break through to form a line of mud volcanoes just like the thumbprints. Various stages of this progression are observed along the Utopia Planitia slope.
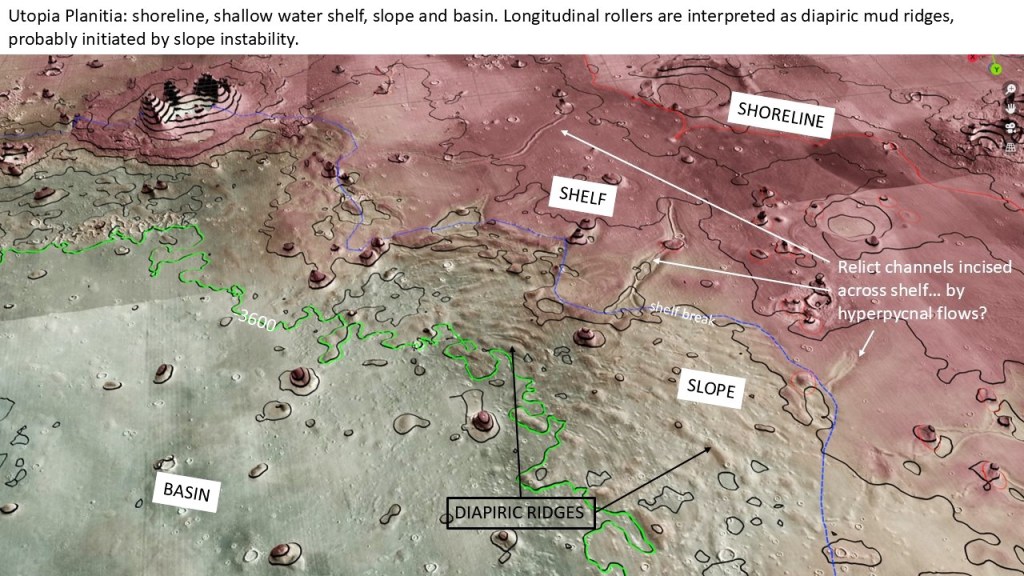
Conceptual model for the diapiric ridges:
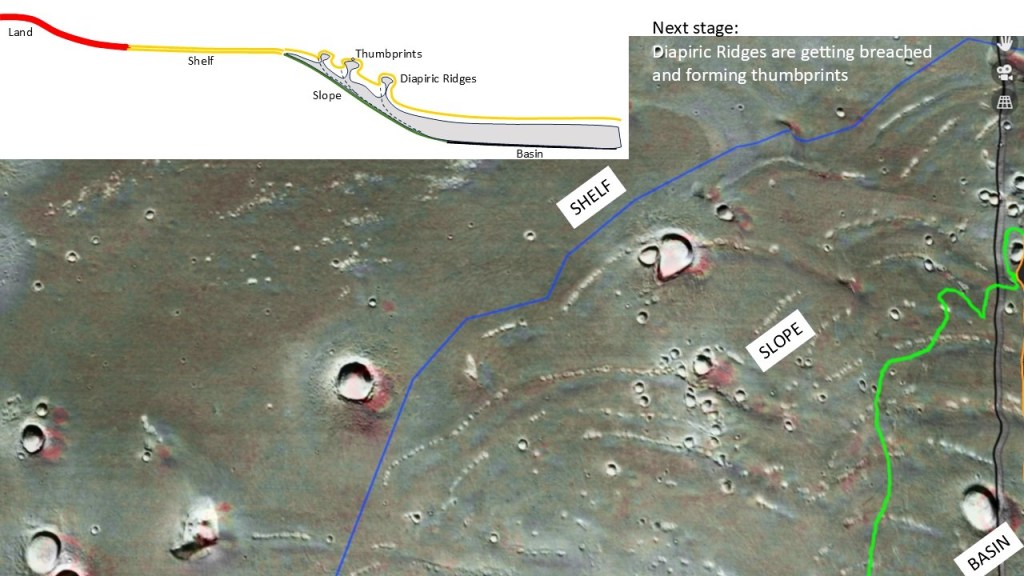
(the fault-induced diapiric model is somewhat speculative; the fractured MF model may still apply here, and may play a role in constructing these ridges and their piercements)
Continuation of the -3900 shoreline
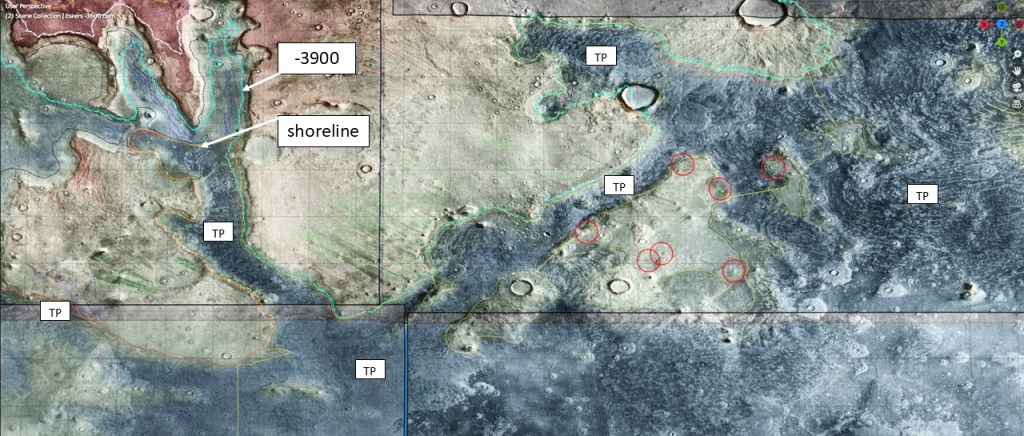
Turning back to the shoreline discussion, we find that away from the Okavango Delta we rely largely on the distribution of Thumb-Print terrain to discriminate between land and ocean, especially in the canyons where the shoreline abuts the walls.
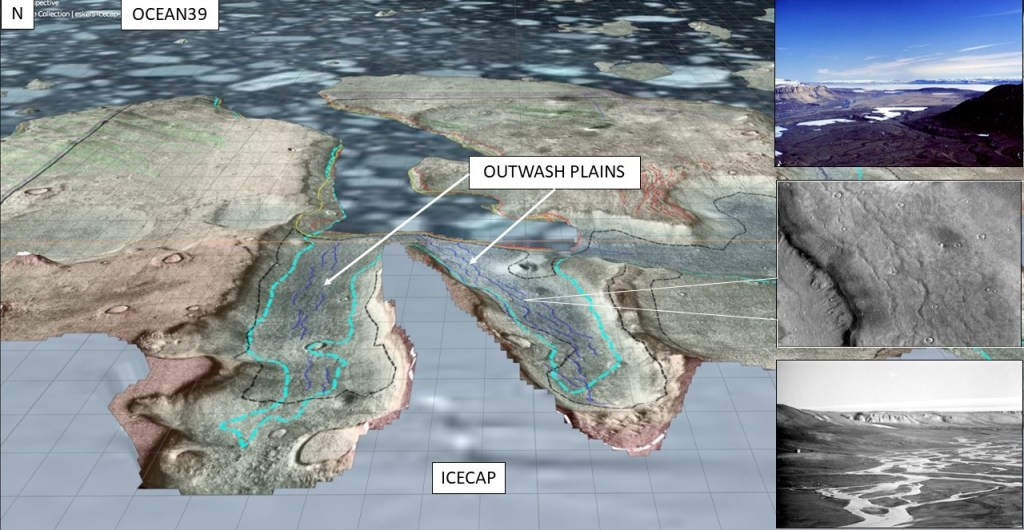
Before we leave this area, I’d like to point out one more interesting feature: some outwash plains that may or may not be glacially sourced (there are no obvious rivers debouching into these canyons). Drainage seems to be into Ocean39, so this may be evidence of an icecap present at that time. NE Greenland for analog.
For the rest of the traverse along the 39 coastline we employ, among other things, N/D IR displays:
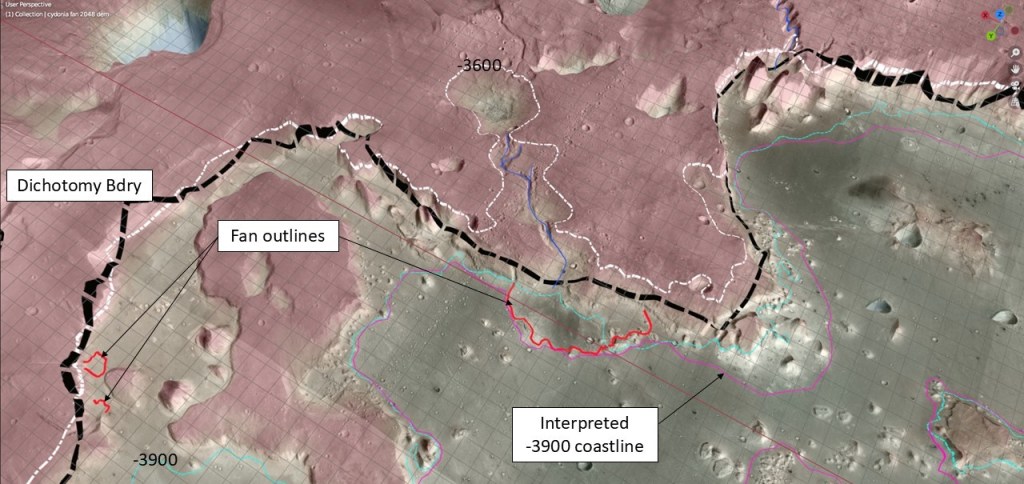
The Cydonia Mensae area is particularly chaotic, but it offers one bit of circumstantial evidence: several fans at the base of the dichotomy boundary cliff, whose abrupt terminations are just about at the proposed waterline.
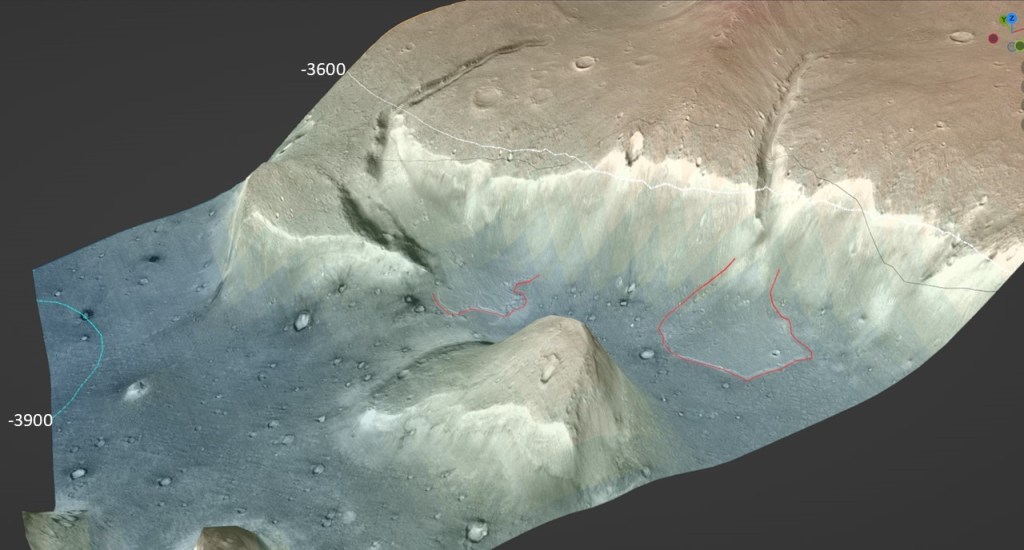
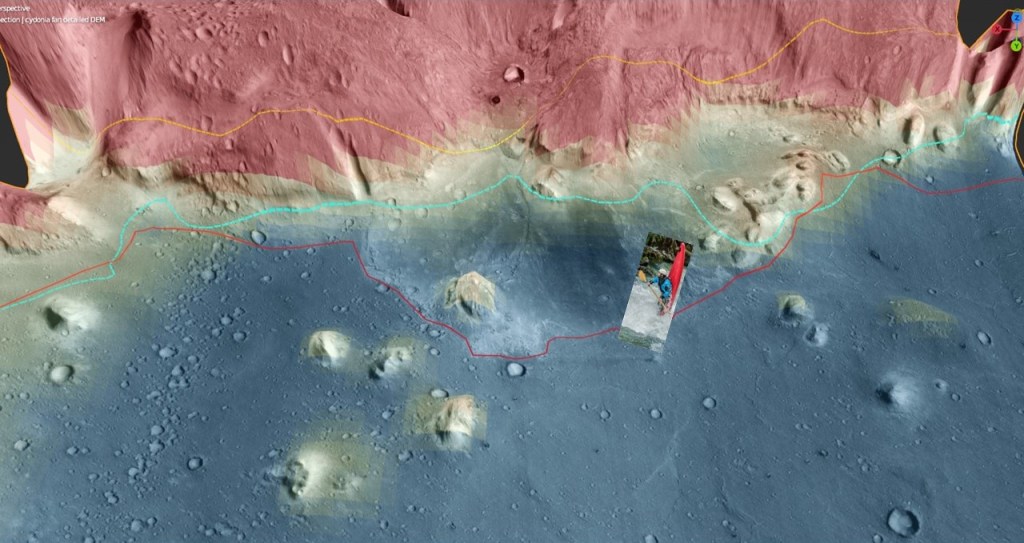
The bottom picture is interesting in that, although it has the general outline of a fan, portions of it are actually depressions with respect to the sea floor. Perhaps the gradient of the flow was steep enough to form a hydraulic jump when it encountered the ocean, and cause erosion at the base. In any case, if it demonstrates standing water, it proves the point.
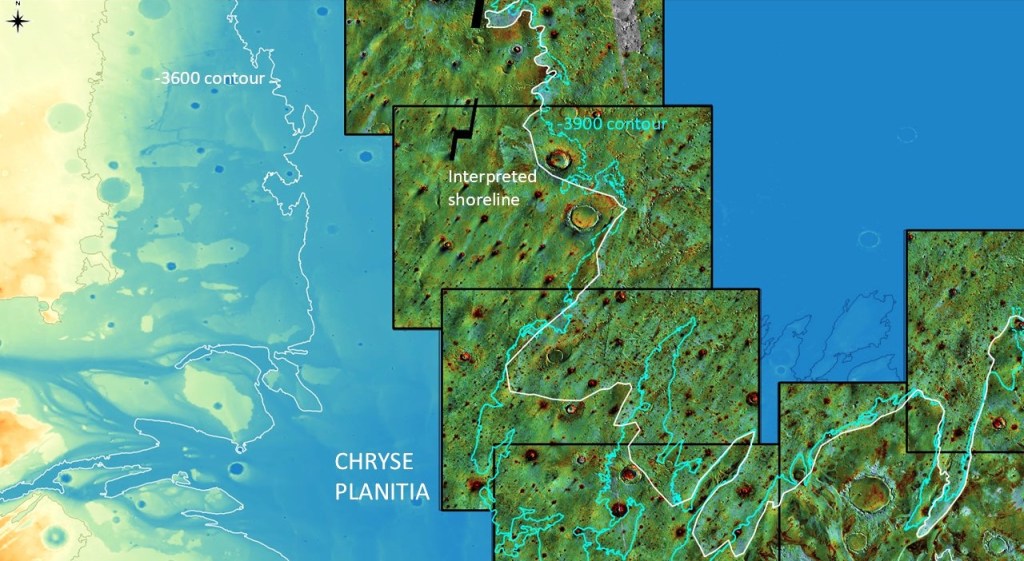
Regional context for the above:
In the Chryse area, thermal properties are once again used in distinguishing the coastline:
At “Tempe Bay” it gets quite definitive…
Close up, without interpretation…
Farther up the coast, at Tantalus Fossae…
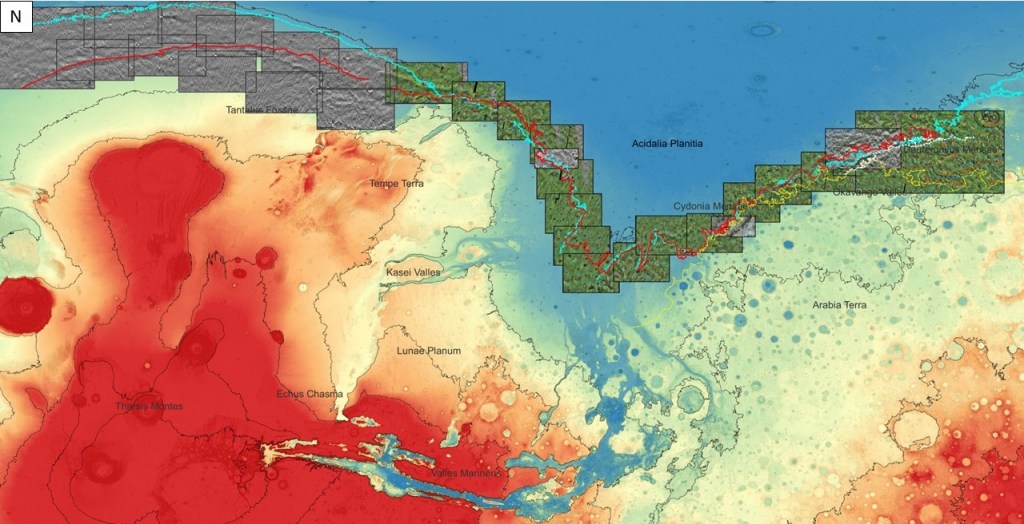
So, having gone about 7650 km along the -3900 coastline (not counting the bays and promontories), it’s time to look at the big picture:

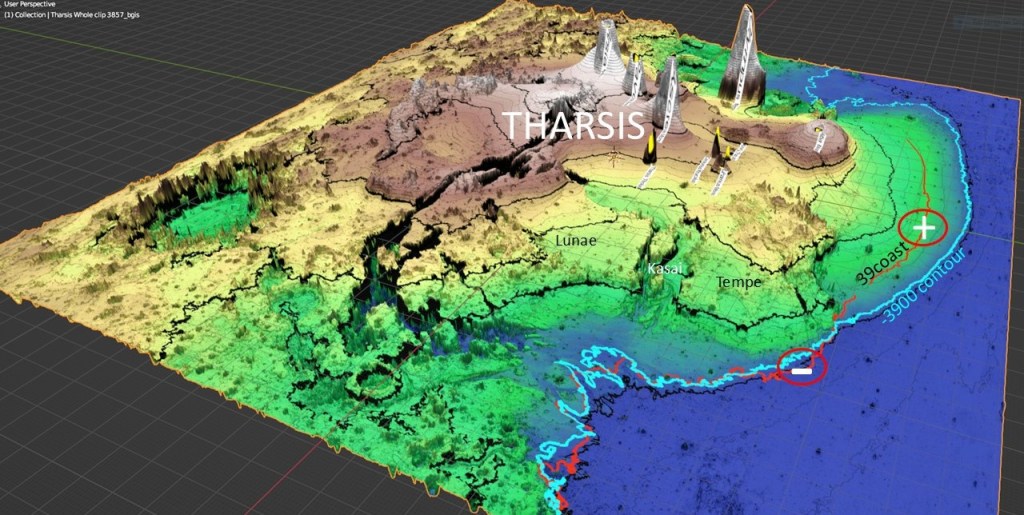
Posting the elevation profiles of the 36 and 39 coastlines reveals a dramatic climb across the Tharsis rise, indicating that at least some of the Tharsis complex inflation post-Ocean39:
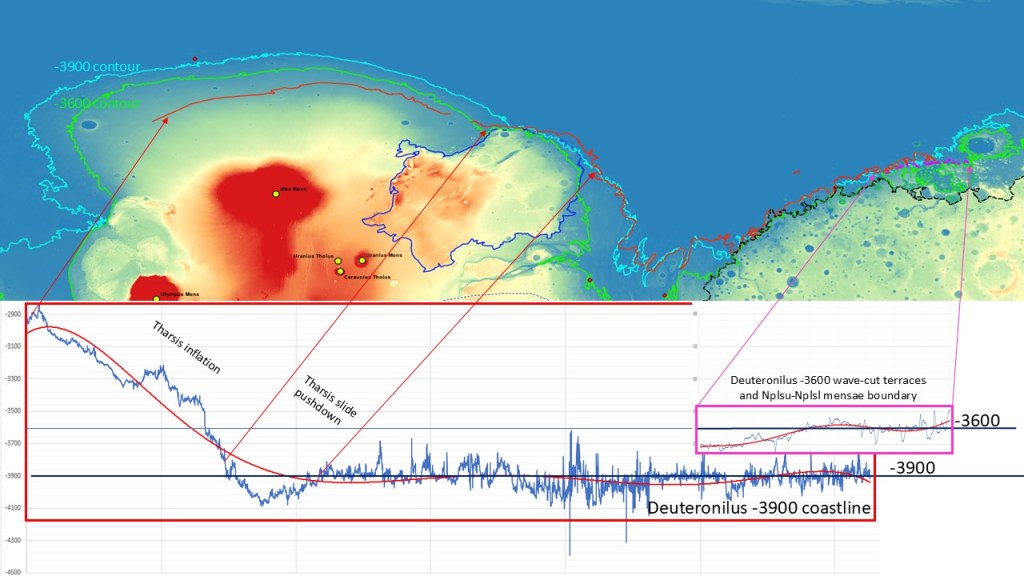
This gets us into a discussion of some complexity, and it has to be taken in a number of steps:
- First Tharsis inflation
- Emplacement of the northern ocean, evidenced by the -3900 shoreline
- Second Tharsis inflation
- Uplift of the paleo-shoreline
- Emplacement of the Tempe Terra slide terrain
- Suppression of the paleo-shoreline opposite the slide terrain resulting from crustal loading
- Separation/rotation/translation of Lunae Planum
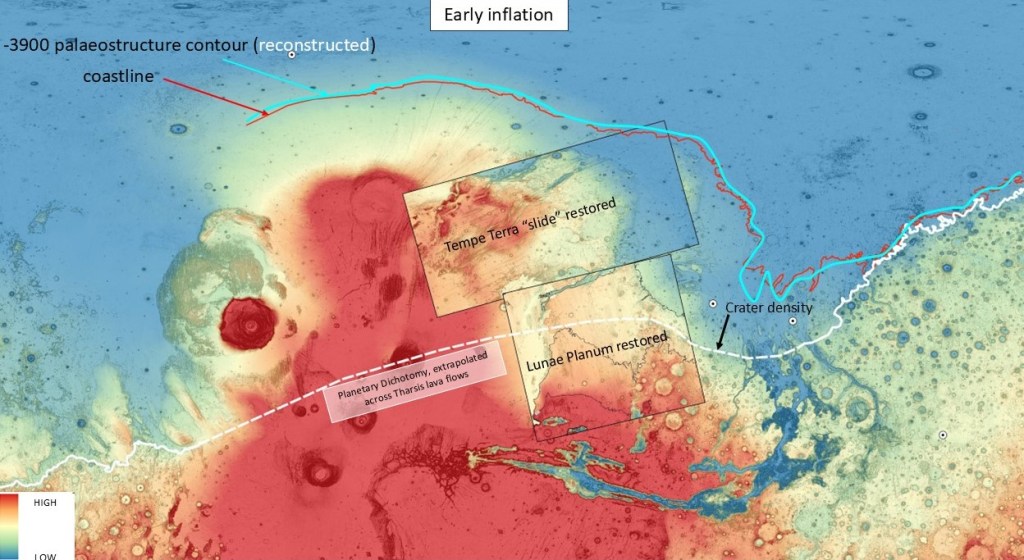
To illustrate these steps by means of a series of slides, we begin with a reconstructed picture of the situation following the initial Tharsis inflation.
The Dichotomy Boundary is extrapolated across the Tharsis Rise, because there is no physical evidence for it, having been resurfaced by successive lava flows.
The Northern Ocean and its coastline would normally track the dichotomy fairly closely, but here we see it diverging northward to wrap around the pre-existing Tharsis bulge. The red coastline is fixed, so the blue paleo-structure contour is reconstructed, as being -3900, as it is in the rest of the basin.
The Tempe Terra slide complex is reconstructed back to where it is thought to have originated, repairing the symmetry of the original Tharsis Rise.
The Lunae Planum slab is also rotated back to its presumed original position, closing the gap between the scarps (shown a few slides ahead); there is a hint of the dichotomy where the crater density falls off to the north, but most of it is overprinted by lava flows.
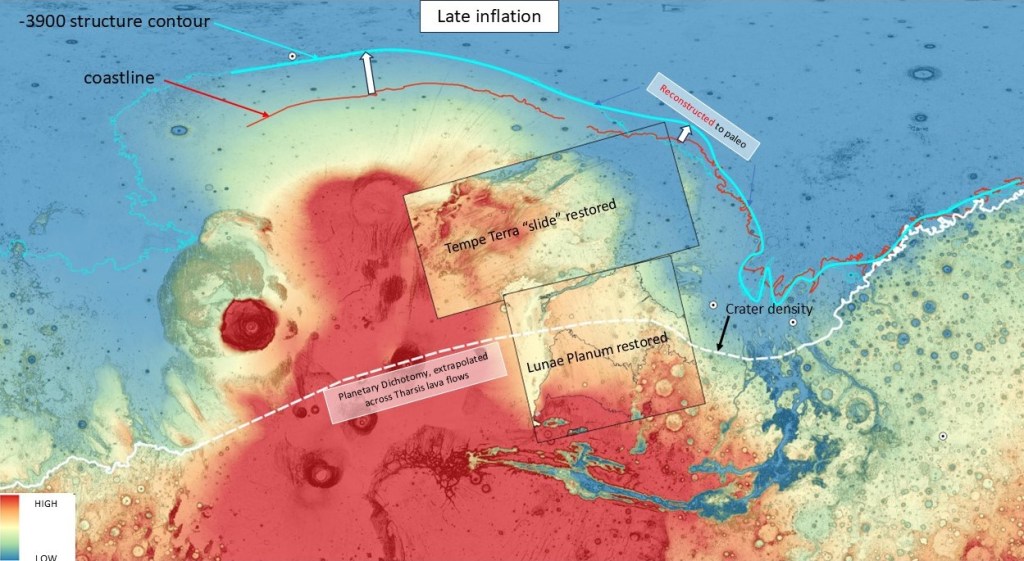
After the second inflation, the coastline is still fixed in the XY plane, but is raised significantly. The -3900 contour is displaced northward with the growing bulge, to its present-day position. The section opposite the Tempe Terra slide is still reconstructed to where it would be post-inflation and pre-slide.
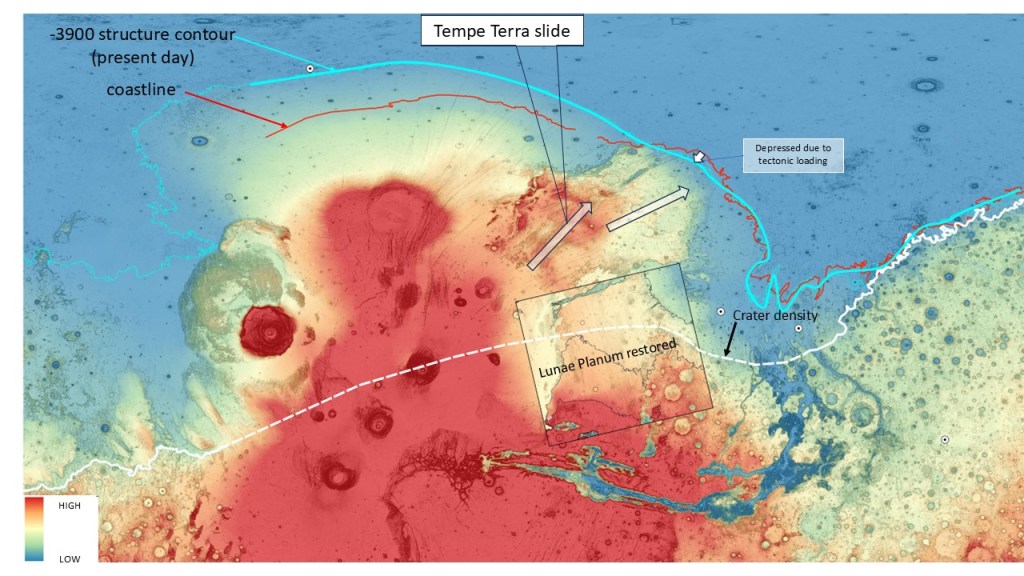
The Tempe Terra slide (maybe in two phases) cuts loose and depresses the crust to bring the -3900 contour to its present location. The coastline is still in the same XY location, but now below -3900m.
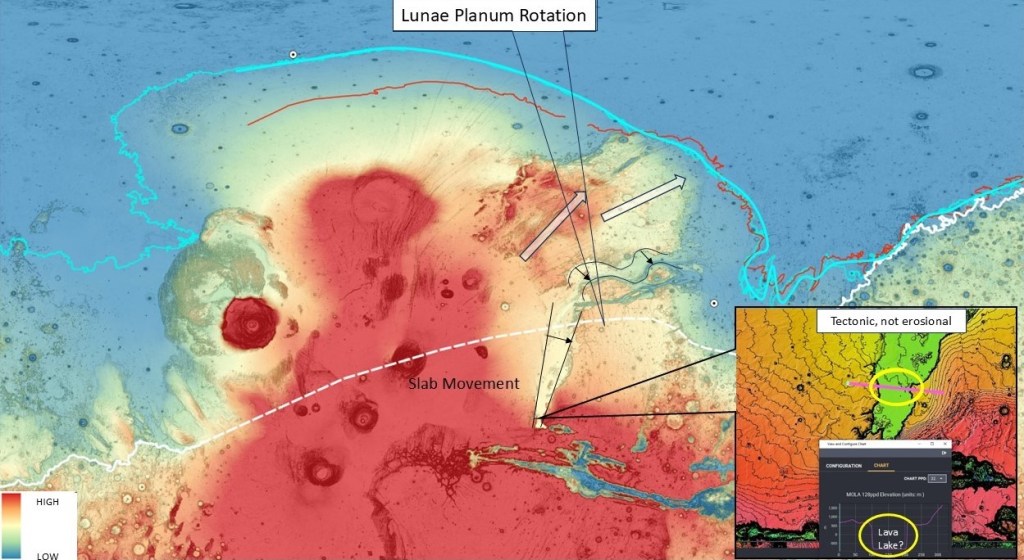
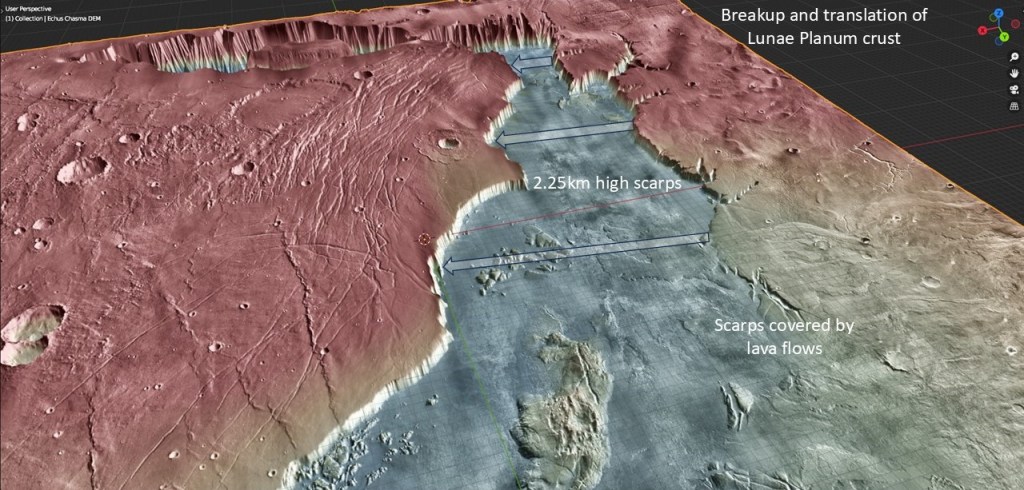
The final act is the opening up of the huge cleft that forms Echus Chasma and Kasai Valles, looking like a failed triple-junction arm. Sheer 2.25km scarps forming both sides, and a flat lava-lake type base indicate its tectonic rather than erosional origin, although later in its history it did support massive outflow channels.
An oblique view toward Echus Chasma, with lava flows obscuring part of the northern rim.
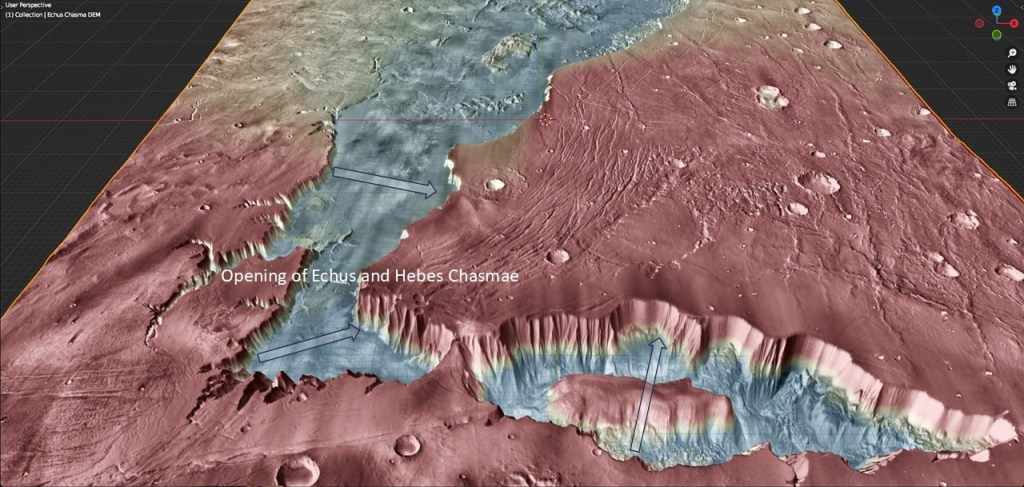
Looking North from Hebes and Echus Chasma; perhaps they both opened up at about the same time.
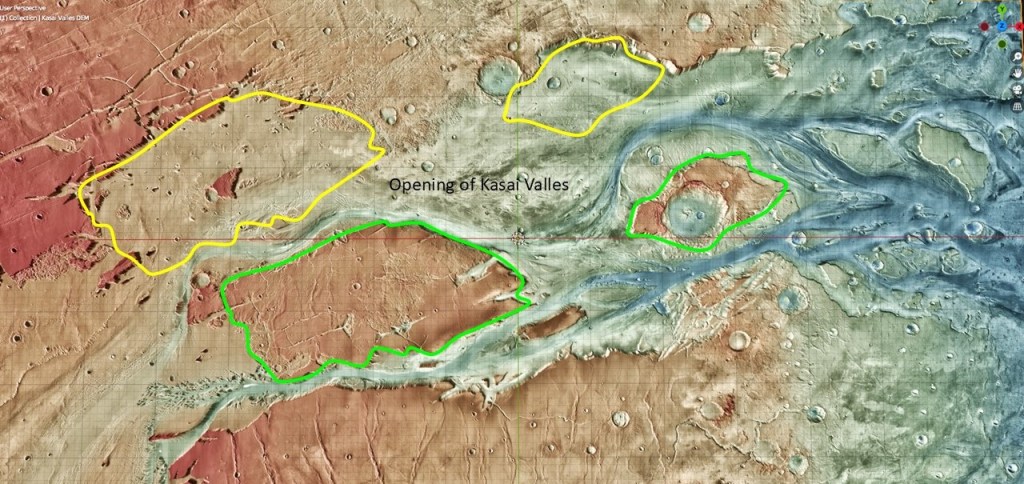
Looking down on Kasai Valles, showing how the pieces fit
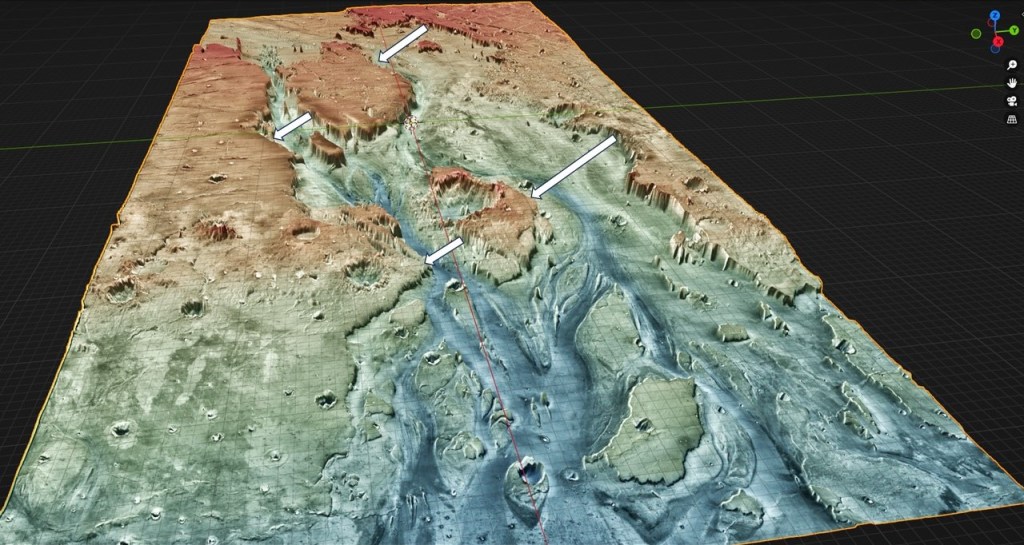
Oblique view of Kasai Valles, indicating the direction of the opening. It subsequently became a huge catchment area for high energy outflow channels.
Summary and Conlusion
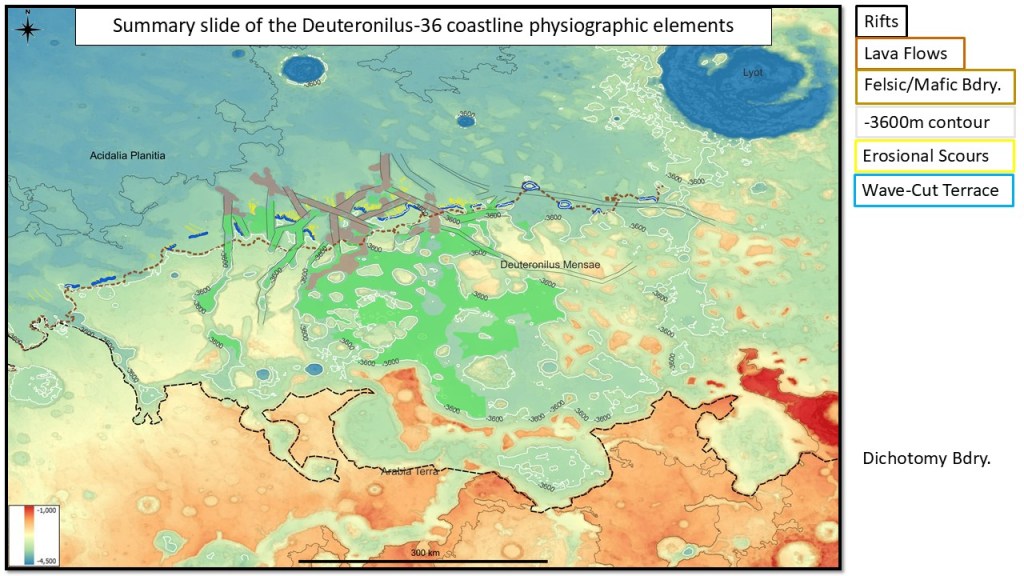
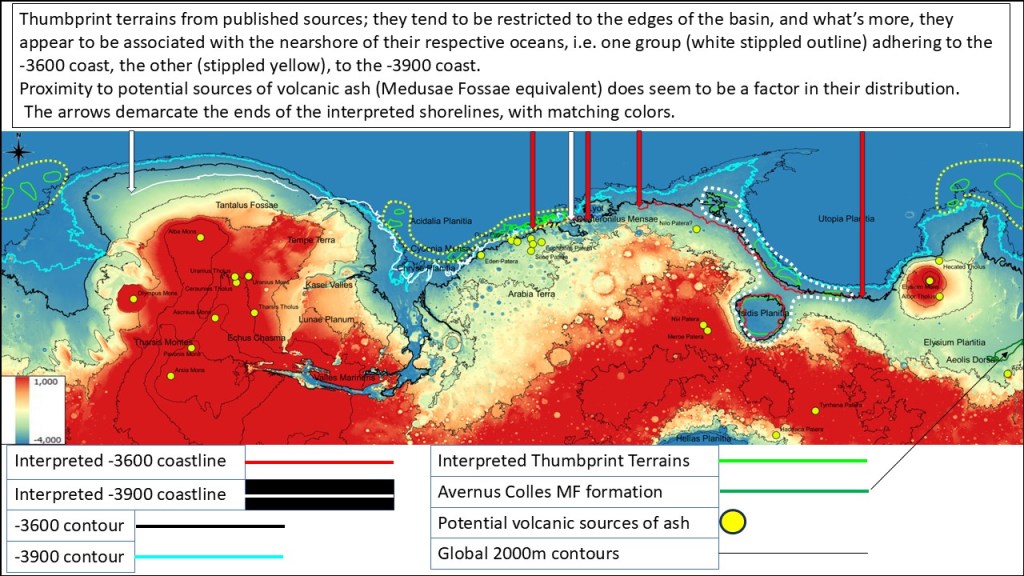
Finally, looking at a regional picture of the interpreted shorelines and their associated thumbprint terrains, the following generalizations can be made: the TP terrains lie just outboard of their respective shorelines, and within reach of potential volcanic sources for the deposition of a Medusae Fossae type caprock; and the fact the same volcanic activity seems to occur for both Ocean36 and Ocean39. This implies a possible link between volcanism and ocean creation, i.e. that climate cycles were determined by volcanism and CO2 out-gassing leading to a dense atmosphere, a water cycle, and glaciation as well as heating of the cryosphere and associated deluges, punctuated by “snowball Earth”-like episodes when the atmosphere was largely lost and water and ice sublimated away. (These cold episodes are analogous to the Sturtian and Marinoan during Earth’s Cryogenian period). Here we have two warming episodes, one filling Ocean36, only to have it sublimate away as the planet cooled after the loss of the greater part of its atmosphere. Subsequently, the Deuteronilus rifting event signifying regional magmatic and volcanic activity, initiated another warming cycle, with a reconstituted atmosphere and a new, lower Ocean39.
This is admittedly a thought experiment and a just-so story (as is most of this presentation). But at least it is testable once we get on the ground there and find real geologic evidence of shorelines, diamictites, cap carbonates, etc
